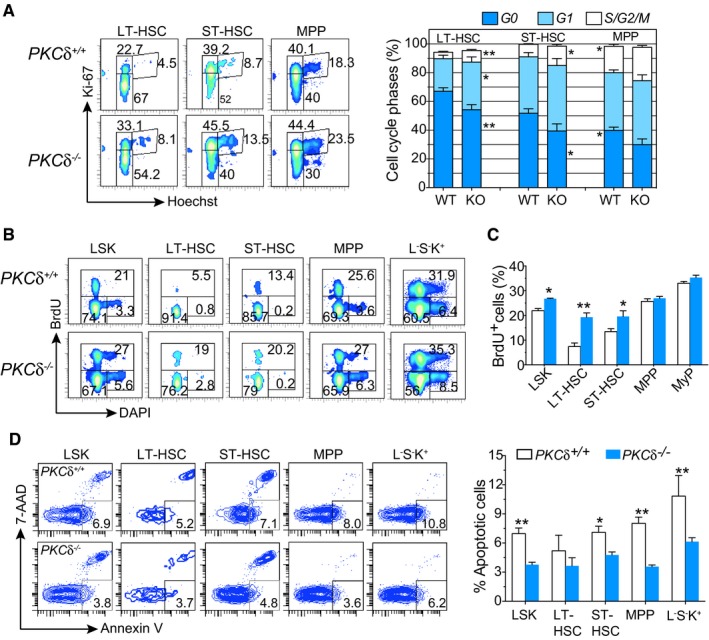
Representative FACS profiles of HSPC cell cycle analysis using combinatorial staining for Ki67 and Hoechst 33342. Bar charts depict the average percentage of cells in each phase of the cell cycle for each LSK subset from WT (n = 6) and PKCδ KO (n = 7) mice. Data compiled from two independent experiments.
FACS profiles of indicated BM subsets from WT and PKCδ KO mice 20 hr after BrdU injection.
Average percentages of cells in each phase of the cell cycle phases for each of the indicated HSPC subsets from WT and PKCδ KO mice. Data are pooled from two independent experiments (totaling n = 6–7 mice per genotype).
Representative FACS plots and summary of FACS data analyzing the frequency of apoptotic HSPC cells using co‐staining for Annexin V and 7‐AAD (WT and PKCδ
−/− (n = 7 per genotype).
Data information: All data are presented as mean ± SEM, *
P < 0.05 and **
P < 0.001, with significance determined by two‐tailed Student's unpaired
t‐test analysis.

