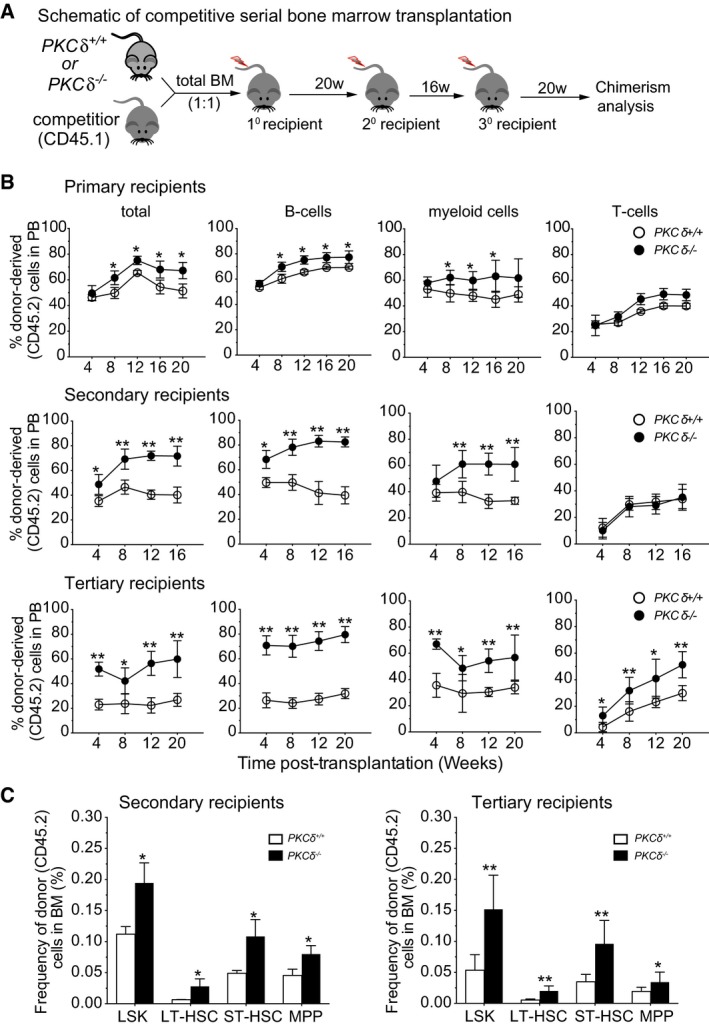
Schematic of competitive BM transplantation assay.
Percent of total donor‐derived, hematopoietic cells (CD45.2+), B cells (B220+), myeloid cells (CD11b+Gr1+), and T cells (CD3+) in the peripheral blood (PB) of recipient mice, as determined by FACS at the indicated time points. The statistical significance of differences was determined using two‐way ANOVAs with Holm–Sidak's multiple comparisons tests (n = 8 recipients per genotype in each experiment).
Percent donor‐derived HSPCs in the BM of secondary (left) and tertiary (right) recipients of WT or PKCδ
−/− marrow. Data are compiled from two independent experiments (n = 8 recipients per genotype).
Data information: All data are presented as mean ± SD. *
P < 0.05, **
P < 0.001, with significance determined by repeated measures two‐way ANOVA analysis with Sidak's multiple comparison tests for comparison of recipients of WT and PKCδ KO marrow at each time point and for each cell population.

