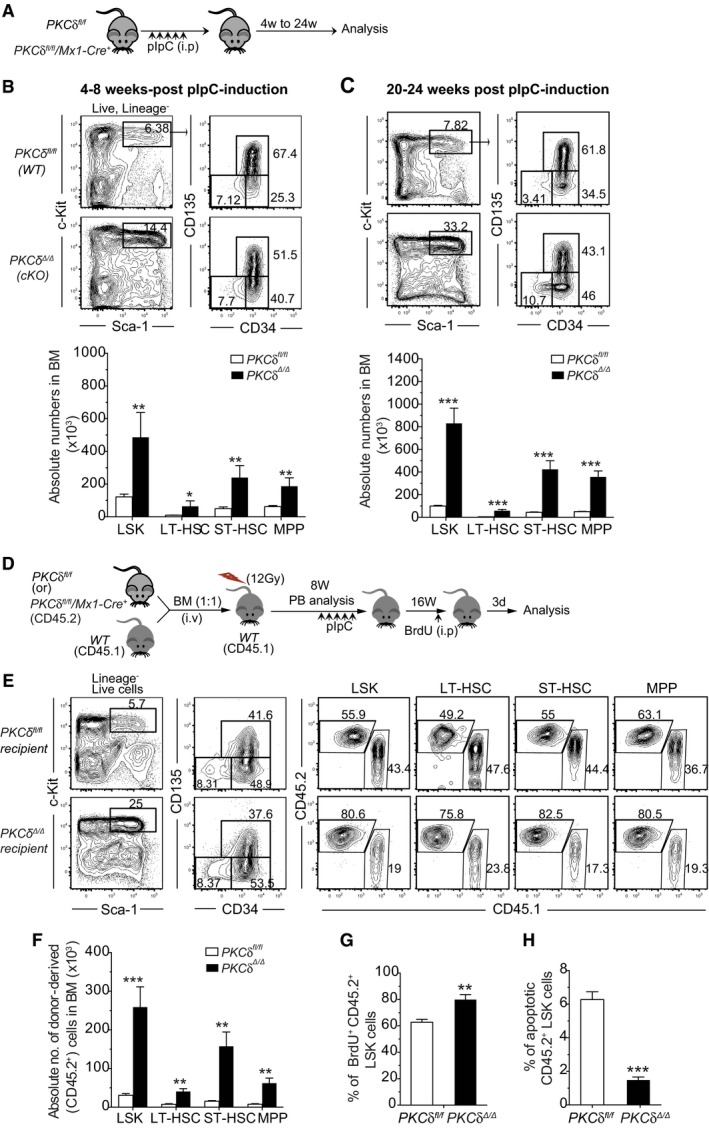
Figure 4. Augmented HSPC pool size following loss of PKCδ in hematopoietic and stromal cells.

-
AExperimental design for pIpC treatment and analysis of PKCδ fl/fl /Mx‐1Cre − (PKCδ fl/fl) and PKCδ fl/fl/Mx‐1Cre + (PKCδ Δ/Δ, cKO) mice.
-
B, CRepresentative FACS plots of PKCδ fl/fl and cKO BM 4–8 weeks (B) and 20–24 weeks (C) after pIpC treatment. Numbers in plot indicate the absolute numbers of the indicated subset within the gated population (n = 8–9 mice per genotype and time point).
-
DSchematic of competitive BM transplants. Total BM cells from either PKCδ fl/fl/Mx‐1Cre − (control) or PKCδ fl/fl/Mx‐1Cre + mice were injected together with recipient type (CD45.1) BM cells (1:1) into lethally irradiated CD45.1 mice prior to pIpC treatment. Two months after transplant, both groups of mice received five doses of pIpC. Chimeras were analyzed at 16 weeks after the last pIpC injection.
-
E, F(E) FACS plots show contribution of donor‐derived (CD45.2+) HSPCs in recipient BM (E). Calculated absolute numbers of donor‐derived HSPC subsets in transplanted mice (F) (total of n = 7–8 mice per genotype).
-
GAverage percentage BrdU+ HPSCs (3 days after BrdU injection into mice reconstituted 24 weeks previously with control or cKO marrow and injected 16 weeks previously with pIpC, see panel (D)) among donor‐derived LSK cells in the control and cKO chimeras BM.
-
HPercentages of apoptotic cells (Annexin V+/7‐AAD−) in donor‐derived LSK cells in control and cKO chimera mouse BM at 24 weeks after transplant and 16 weeks after pIpC injection. Data are compiled from two independent experiments (total of n = 7–8 mice per genotype).
