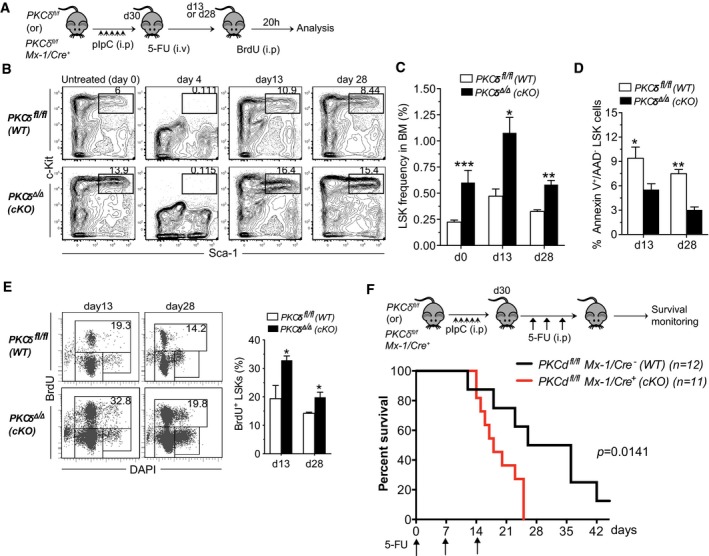
Experimental design. Thirty days after the last pIpC injection, PKCδ
fl/fl and PKCδ cKO mice were treated with a single dose of 5‐FU (150 mg/kg, i.p.) and analyzed subsequently by FACS and BrdU incorporation studies.
Kinetics of LSK cell recovery. Representative FACS profiles of BM LSK cells from WT and cKO mice at the indicated time points after 5‐FU treatment. Numbers in the contour plots indicate the percentages of LSK subsets among Lin− live cells.
Average absolute numbers of BM LSK cells at day 13 and day 28 after 5‐FU treatment. Data are pooled from two independent experiments (total of n = 6–8 mice per time point and genotype).
Quantification of apoptotic HSPCs at the indicted time points after 5‐FU treatment of control and cKO mice (n = 6 per genotype).
Representative FACS plots showing analysis of in vivo BrdU incorporation assays. Mice were received 2 mg of BrdU (i.p.) at d13 (left) or d28 (right) after 5‐FU treatment. 20 hours later, BrdU incorporation in BM LSK cells was assessed using anti‐BrdU antibodies. Bar chart at right indicates percent of BrdU+ LSK cells at d13 and d28 after 5‐FU treatment (n = 6 per genotype and time point).
Kaplan–Meier survival cures of control (n = 12) and cKO (n = 11) mice after sequential 5‐FU treatment. Mice were treated with 5‐FU (150 mg/kg, i.p.) once each week for 3 weeks. Arrows indicate time points of 5‐FU injection.
Data information: Data presented as mean ± SEM. The statistical significance was assessed using repeated measures two‐way ANOVAs with Sidak's multiple comparisons tests (C) or by two‐tailed Student's unpaired
t‐test analysis (D and E). *
P < 0.05, **
P < 0.01, and ***
P < 0.001. Survival data (F) were analyzed using a log‐rank nonparametric test (Mantel‐Cox test) (
P = 0.0141).

