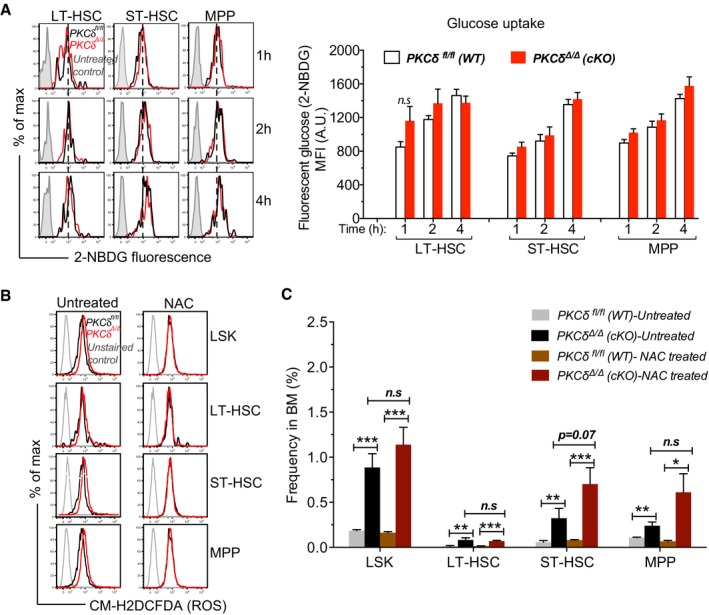
Figure EV5. Altered metabolic activity in PKCδ‐deficient cKO HSPCs is not due to impaired glucose uptake, and inhibiting ROS levels via NAC treatment does not rescue increased HSPC pool size in PKCδ‐deficient BM.

- FACS‐sorted HSPC subsets were incubated with 2‐NBDG for the indicated time. Representative histograms of 2‐NBDG fluorescence at time indicated. Mean fluorescence intensity (MFI) of 2‐NBDG fluorescence at indicated time. Cells treated without 2‐NBDG used as controls. (n = 5 mice per genotype, mean ± SEM).
- NAC treatment rescued the increased ROS levels in PKCδ‐deficient HSPCs. Representative histograms of CM‐H2DCFDA fluorescence.
- NAC treatment did not rescue increased HSPC pool size in PKCδ‐deficient BM. Bar graph represents HSPC frequency 8 weeks after NAC treatment. Untreated PKCδ fl/fl and PKCδ Δ/Δ (cKO) mice were used as controls (n = 6 mice per genotype).
