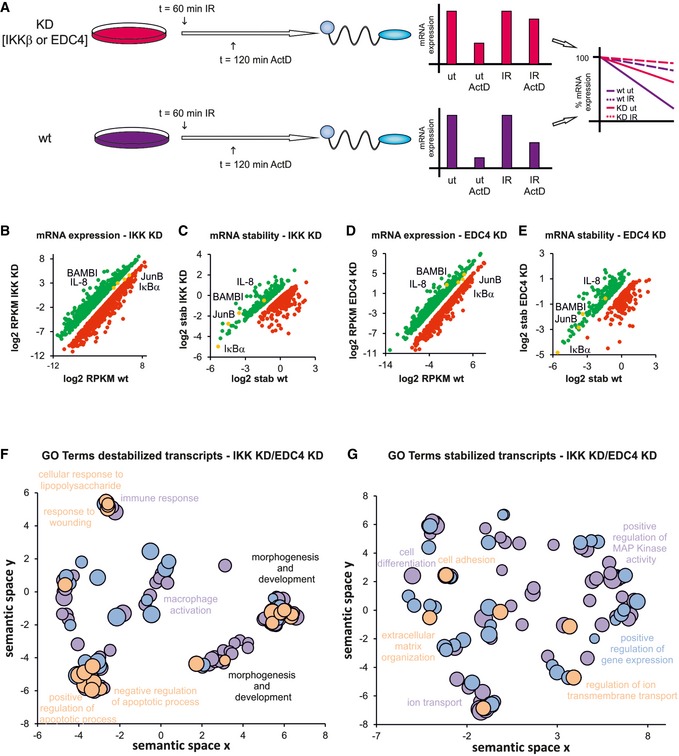
Figure 4. EDC4 and IKK regulate stability of multiple transcripts.

- Schematic diagram of ActD chase experiments to determine stability of transcripts. pTRIPZ constructs encoding shIKKβ or shEDC4 (as above) were treated with dox to induce knockdown (KD, IKKβsh, EDC4sh) or left untreated (wt). ActD treatment, 120 min, IR at 60 min prior to harvest. RNA was analysed by qRT–PCR. Bar charts represent raw data. Line graphs represent normalized stability, were IR or unstimulated samples were set at 100% and ActD‐treated samples represent residual expression.
- Graph showing mRNAs with increased (green) or decreased (red) expression in IKK‐depleted cells (see A) relative to wt. mRNA expression was measured by RNA‐Seq, and significance was calculated for two corresponding conditions and cut‐off set for P‐value < 0.1 and fold change > 2 (Table EV4A)
- Graph illustrating mRNAs with increased (green) or decreased (red) stability in IKK‐depleted cells (see A) relative to wt. mRNA stability was determined by RNA‐Seq (Table EV4B).
- Analysis of mRNA expression in EDC4‐depleted cells relative to wt as in (A; Table EV4C).
- Analysis of mRNA stability in EDC4‐depleted cells relative to wt as in (B; Table EV4D).
- GO terms of transcripts which are destabilized by IKK or EDC4 using REVIGO for removal of redundancy of GO terms (Supek et al, 2011). Scatterplot clustering of groups with functionally similar GO terms. Each circle represents a GO term; size indicative of gene target numbers; the x‐axis and y‐axis are semantic coordinates given by REVIGO; violet: EDC4‐depleted, blue: IKK‐depleted, orange: terms identical for both EDC4 and IKK‐depleted samples; P‐value < 0.05 (Table EV4E). Note that semantic co‐positioning in the plot indicates functional similarity of GO terms.
- Visualization of GO terms of mRNAs that are stabilized by IKK or EDC4, as in (F; Table EV4F).
