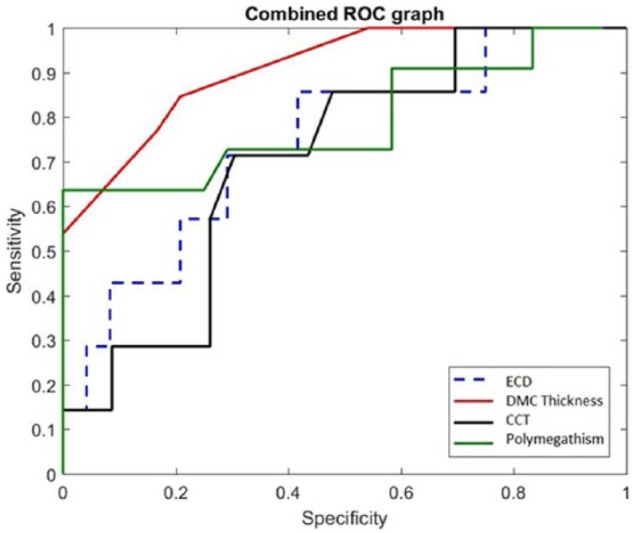
Figure 2.

This graph represents the combined receiver operating characteristic curves of ECD, En/DMT, CCT, and polymegathism. Increased area under the curve represents a better sensitivity and specificity for the diagnostic test. En/DMT had the highest sensitivity and specificity compared with the other parameters. CCT, central corneal thickness; ECD, endothelial cell density; En/DMT, Descemet’s membrane complex thickness.
