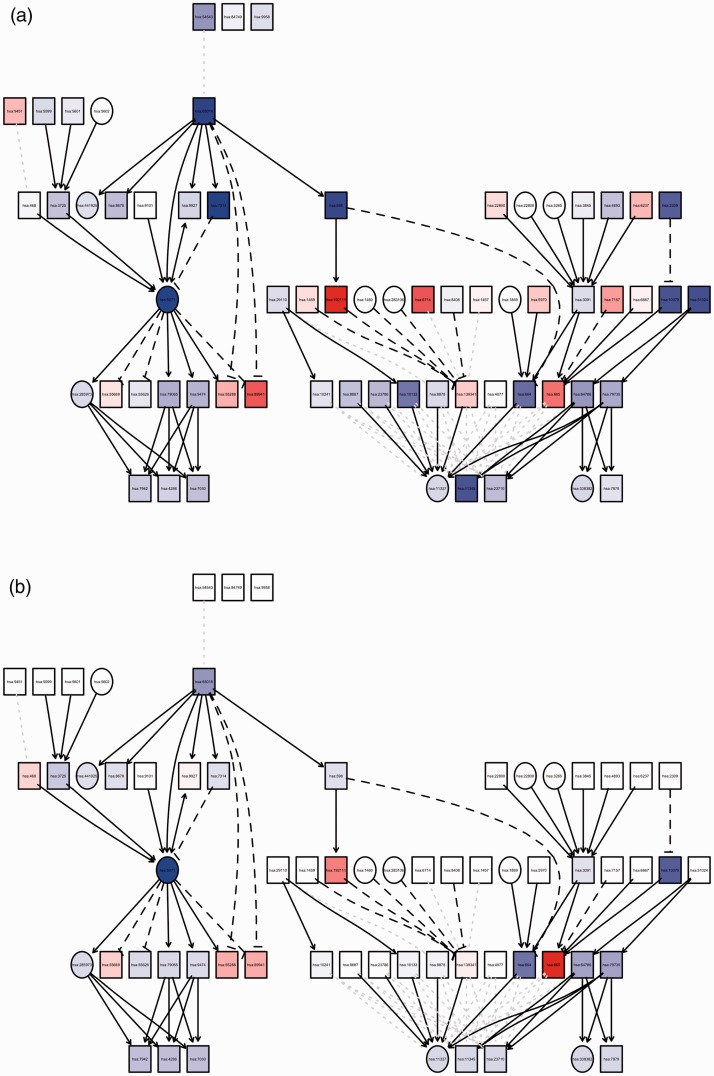
Figure 1.
Graph summary of pathway level statistics. (a) The measured expression change versus (b) perturbation accumulation in the Mitophagy–Animal Kyoto Encyclopedia of Genes and Genomes pathway (hsa04137). The square nodes denote genes with gene expression change, and the circle nodes denote all other nodes. The color of each node represents the perturbation (red = positive, blue = negative), and the shade represents the strength of the perturbation. Note that the square nodes with no parents have no accumulation.

