
Figure 10.
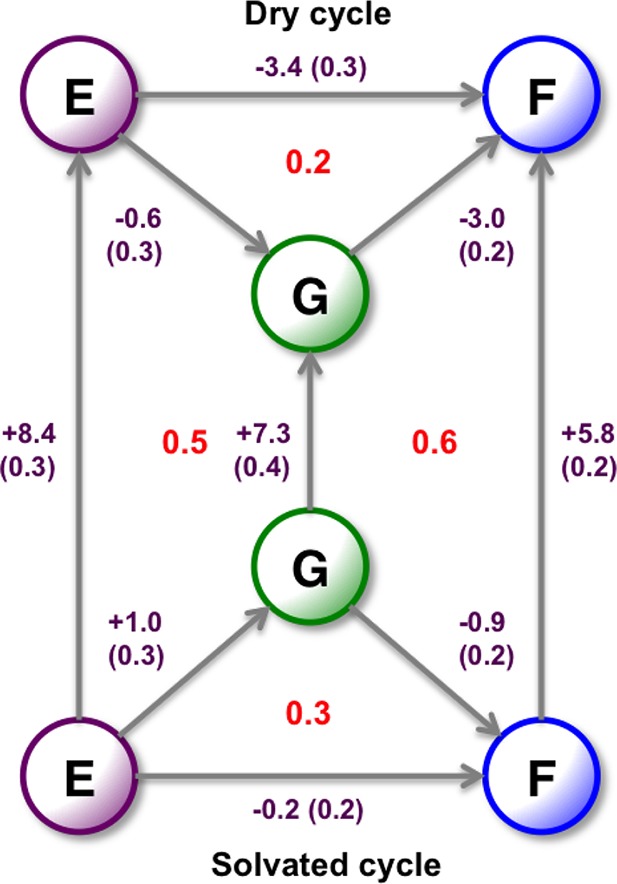
Relative binding free energies of the three A2A ligands in kcal·mol–1. All results are calculated from the 2D-GCAP simulations. The dry cycle is calculated from using MBAR at B−Beq = −8, where the GCMC region is free of water molecules. The solvated cycle is calculated using MBAR on the whole surface, where the ligands will be correctly hydrated, Figure 11. The vertical legs are the free energy of the GCMC water networks, calculated using GCI at the λ end points of the surface. Standard errors are shown, calculated from three repeats for ligand perturbations and six repeats for water network calculations. Thermodynamic cycle closure is shown in red.