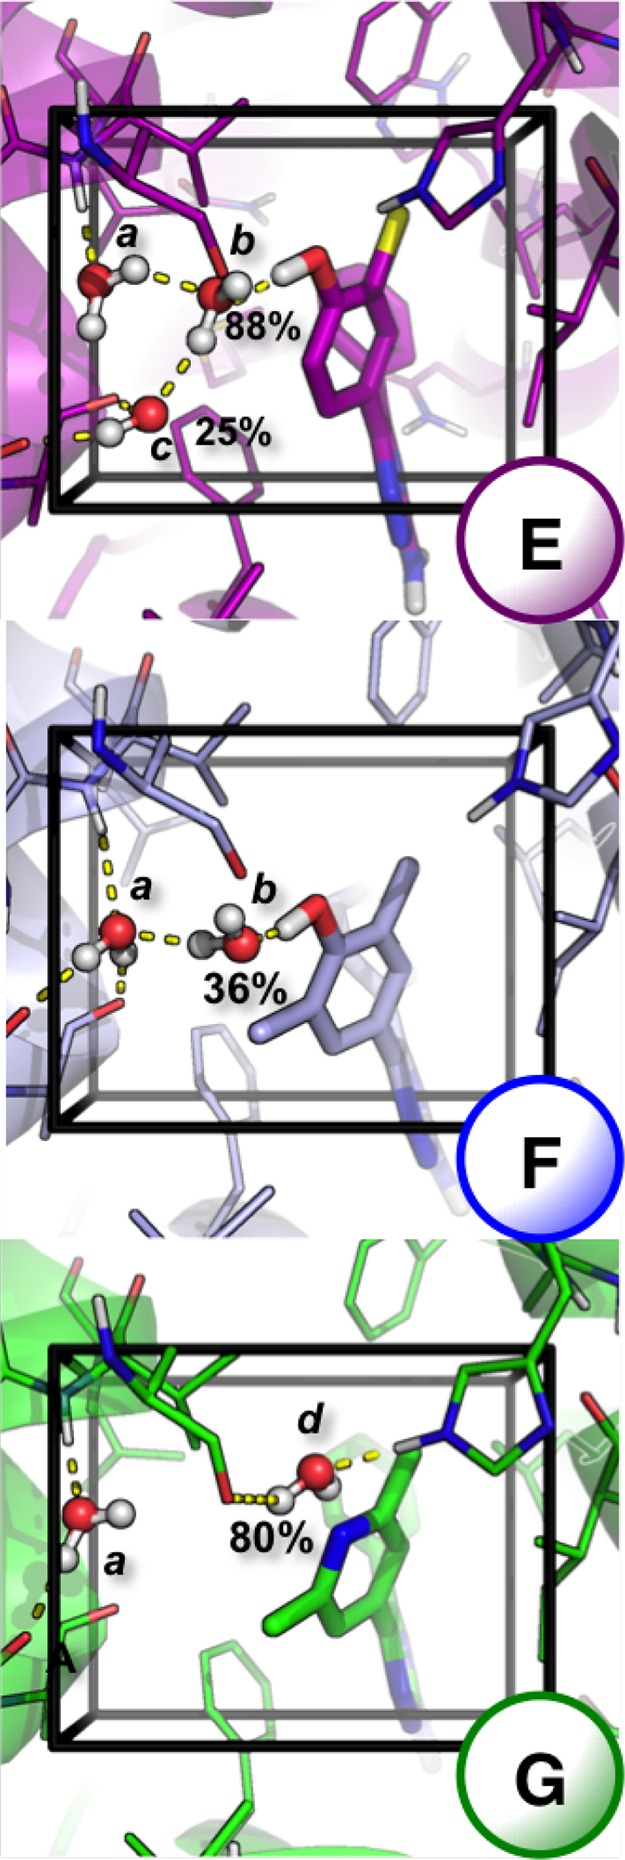
Figure 11.

GCMC water locations top to bottom for ligands E (purple), F (light blue), and G (green) shown as sticks. Additional water sites are observed for all three ligands, in the lower, right region of the GCMC box, but as they are unperturbed by changes to the ligand they have been excluded for clarity, shown in Figure S.3. Protein is represented as a cartoon, with residues shown as lines. Carbon atoms are colored per ligand, with oxygen (red), nitrogen (dark blue), chlorine (yellow), and hydrogen (white). Any nonpolar hydrogen atoms are removed for clarity. Hydrogen bonding (yellow dash) interactions are shown, determined using pymol.55 GCMC hydration sites have been labeled a – d, with water occupancies labeled for waters that are present <95% of the simulation. Water locations have been calculated by clustering,48 and a representative snapshot of the simulation is shown that represents the cluster centers.
