
Figure 4.
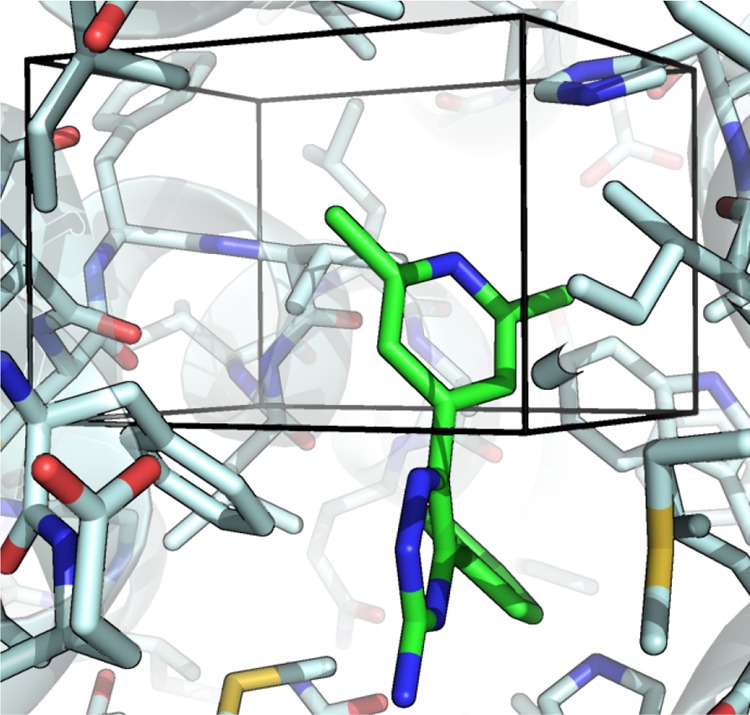
Active site of A2A ligand G (PDB: 3UZA). Protein residues (light blue) Ligand G (green) shown as sticks, with nitrogen (blue), oxygen (red), and sulfur (yellow) shown. The GCMC box region, shown as black lines, covers ring A of ligand G, and the active site cavity near ring A. No water molecules are shown, as there are no resolved water molecules in the crystal structure.