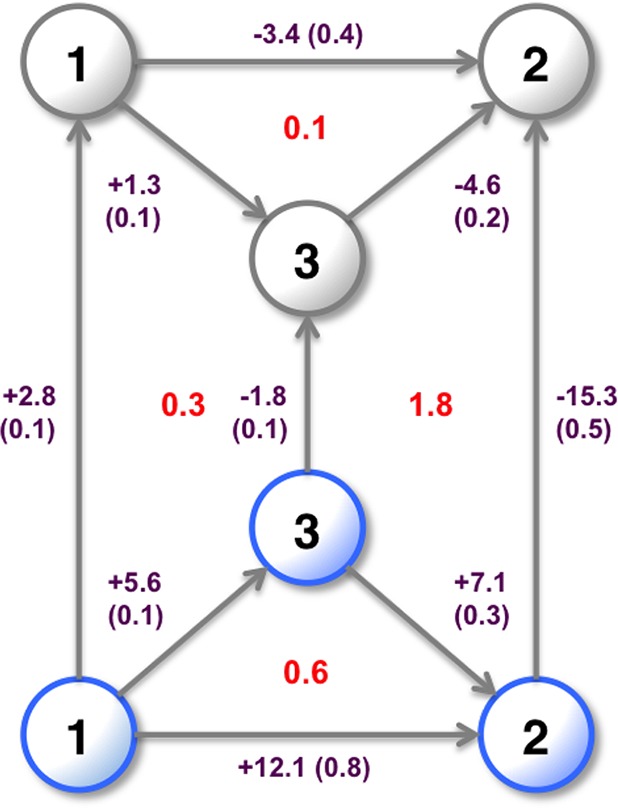
Figure 6.

Relative binding free energies in kcal·mol–1 of ligands 1, 2, and 3, with (blue) and without (gray) the active site water molecule (shown in Figure 2) present. Free energies calculated using MBAR. No GCMC or GCAP simulations were used to generate this map. Vertical legs correspond to the free energy of decoupling the water from the system. This cycle is taken from Michel et al., recalculated with similar conditions where possible using the ProtoMS software package and alternative force fields. Standard errors from four independent repeats are shown in parentheses, and thermodynamic cycle closures in red. The calculated binding free energies include the free energies from the equivalent bulk-water simulations.
