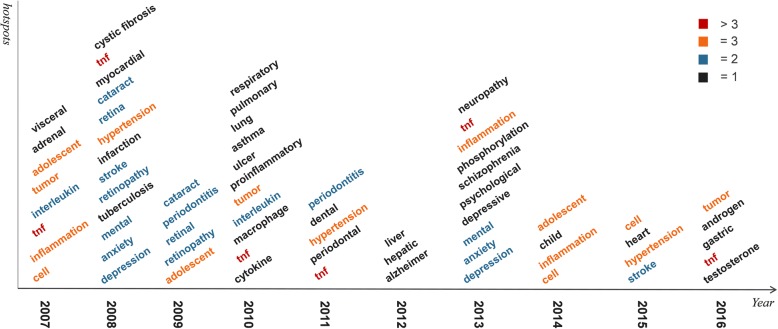
Fig. 7.
Research hotspots of every year from 2007 to 2016 are summarized in this figure. The words which appear more than thrice are marked by red, those appear thrice are marked by orange, those appear twice are marked by blue, and those appear only once are marked by black. (Adapted with permission from [44])

