Fig. 7.
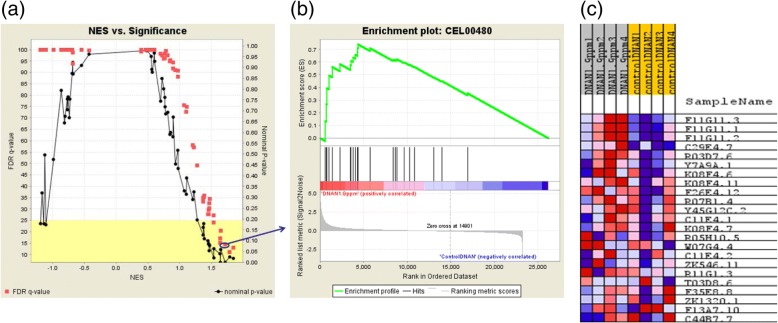
Some examples of gene set enrichment analysis (GSEA) output files: a Normalized enrichment score (NES) plotted against false discovery rate (FDR) or nominal P-value which were derived from GSEA of 134 gene sets (i.e., KEGG pathways, see Additional file 4) in the Control vs. DNAN_1.9 ppm comparison; b Enrich plot of one of the gene set CEL00480 (FDR = 0.14, see the blue circle and arrow in (a)) significantly altered by DNAN_1.9 ppm; and c Microarray gene expression heat map of the 23 genes mapped to the KEGG pathway CEL00480

