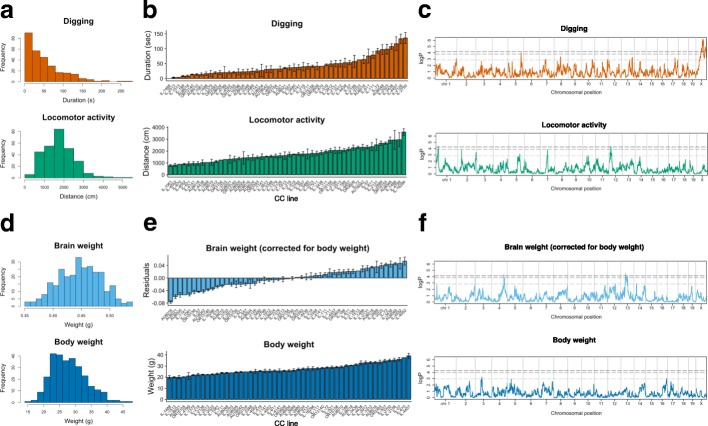
Fig. 2.
Quantitative variation in basic behavioral and physical phenotypes across CC lines and genetic mapping. a Histograms of digging and locomotor activity in 285 CC mice from 53 CC lines. b Digging and locomotor activity obtained from CC lines. Plots are expressed as mean ± SEM, with CC lines ordered along the x-axis by mean per phenotype (one-way ANOVA P = 2.1 × 10⁻²⁵ and P = 1.1 × 10⁻²²; one-way ANOVA after correction for age, batch, and origin P = 1.3 × 10⁻¹⁷ and P = 3.3 × 10⁻¹⁵). c Genome scans for digging and locomotor activity. Significance thresholds were estimated by 1000 permutations. QTLs were detected for digging on the X-chromosome (permuted P < 0.001) and for locomotor activity on chromosomes 1 and 12 (permuted P = 0.042 and P = 0.042). Dashed lines represent genome-wide permuted P < .05, 0.1, and 0.5. d Histograms of brain weight and body weight. e Brain weight (residuals after correction for body weight) and body weight obtained from 53 CC lines. Plots are expressed as mean ± SEM, with CC lines ordered along the x-axis by mean per phenotype (one-way ANOVA P = 1.1 × 10−44, P = 2.0 × 10−48; one-way ANOVA after correction for age, batch, and origin P = 1.1 × 10⁻³², P = 6.0 × 10⁻³⁰). f Genome scans for brain weight (residuals after correction for body weight) and body weight. QTLs were detected for corrected brain weight on chromosomes 4 and 13 (permuted P = 0.034 and P = 0.021), but not for body weight

