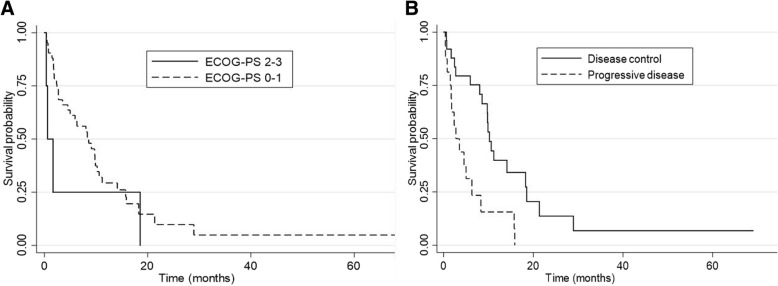
Fig. 2.
Survival curves representing prognostic factors associated with better survival in patients treated with chemotherapy. a shows the better survival for patients with ECOG-PS 0-1 vs ECOG-PS 2-3 (p=0.007). b shows that patients who presented disease control with first-line sorafenib had better survival versus those with progressive disease with sorafenib. (p=0.003)

