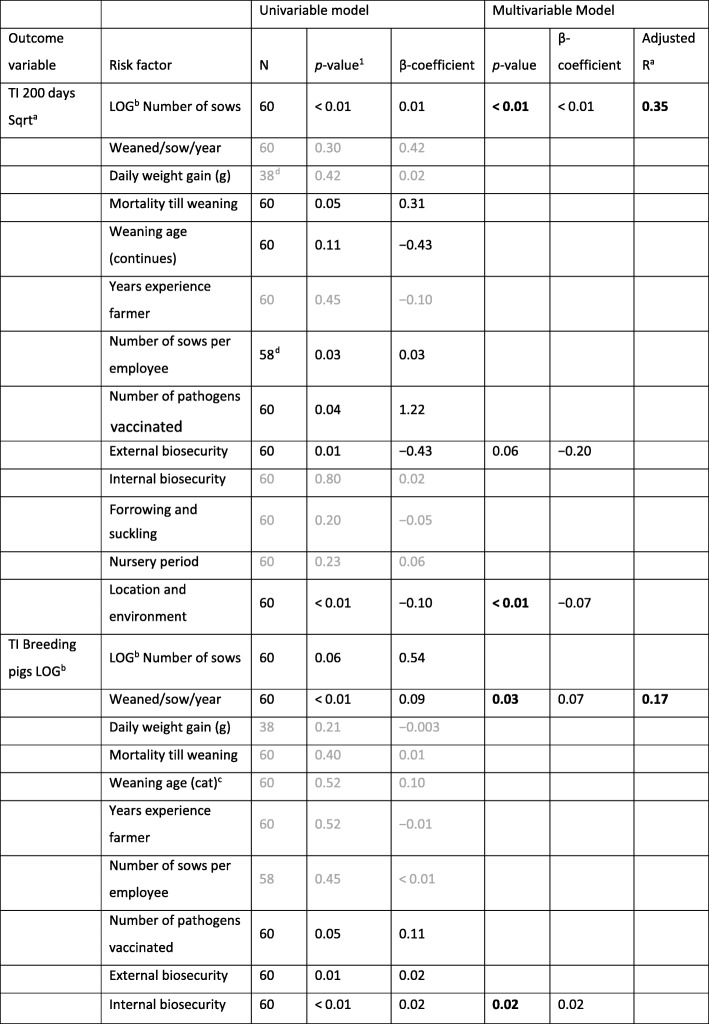
Table 5.
Statistical results of univariable and multivariable linear models for the outcomes TI 200 days and TI breeding pigs
1Light gray values in the univariable model indicate that these factors were not significant (p < 0.20) in the univariable model. In the multivariable model the p-values which are significant with p < 0.05 are black and bold, 0.05 < p < 0.10 are black and p > 0.10 are light gray
aSqrt Square root transformation
bLOG Log transformation
cCat Categorical variable
dData was not available in all participating herds

