Fig. 1.
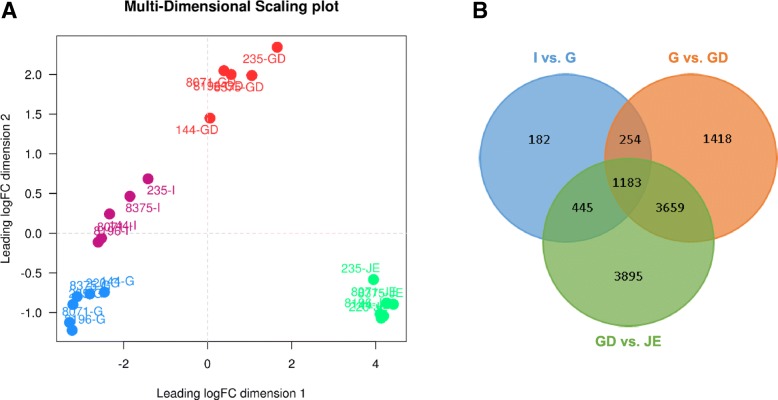
Transcriptome analysis: overlap between samples. a Multi-Dimensional Scaling (MDS) plot showing similarity between samples. Numbers refer to individuals (144, 220, 235, 8071, 8196, and 8375) and letters to tissues (I: isthmus, G: gizzard, GD: gastro-duodenal junction, and JE: jejunum). b Venn diagram showing the number of transcripts differentially expressed that are common between two or more comparisons (I vs G: isthmus vs gizzard, G vs GD: gizzard vs gastro-duodenal junction, and GD vs JE: gastro-duodenal junction vs jejunum)

