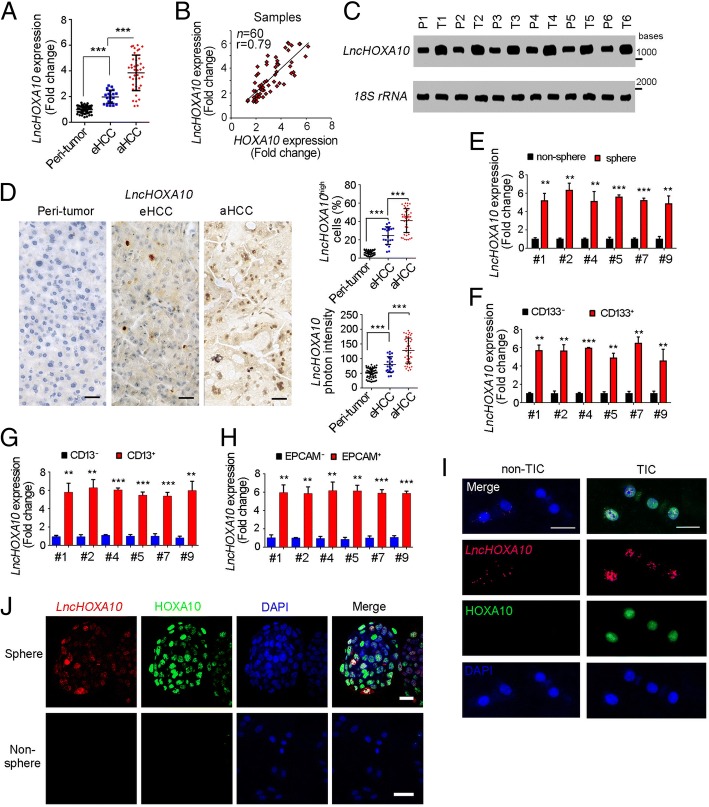
Fig. 2.
LncHOXA10 was highly expressed in liver cancer and liver TICs. a LncHOXA10 expression levels in 60 peri-tumor, 20 early HCC and 40 advanced HCC samples were analyzed through realtime PCR. b Positive correlation between HOXA10 and lncHOXA10 was shown. c LncHOXA10 expression levels were detected through Northern blot. 18S rRNA was a loading control. d In situ hybridization (ISH) of lncHOXA10 in peri-tumor, eHCC and aHCC samples. 60 peri-tumor, 20 early HCC and 40 advanced HCC samples were used. Typical images were shown in left panels and indicated ratios were shown in right panels. e Spheres and non-spheres were collected, and lncHOXA10 expression levels were detected through realtime PCR. All expression levels were normalized to the average expression levels of non-sphere samples. f-h CD133+ (f), CD13+ TICs (g), EPCAM+ TICs (h) and non-TICs were enriched by FACS, followed by realtime PCR examination for lncHOXA10 expression. i, j Fluorescence in situ hybridization (FISH) of lncHOXA10. CD133+ liver TICs (i) and oncospheres (j) were used. Scale bars, D, 50 μm; I, J, 20 μm. Data were shown as means ± s.d. *P < 0.05; **P < 0.01; ***P < 0.001 by one-tailed Student’s t test. Data are representative of three independent experiments

