Fig. 4.
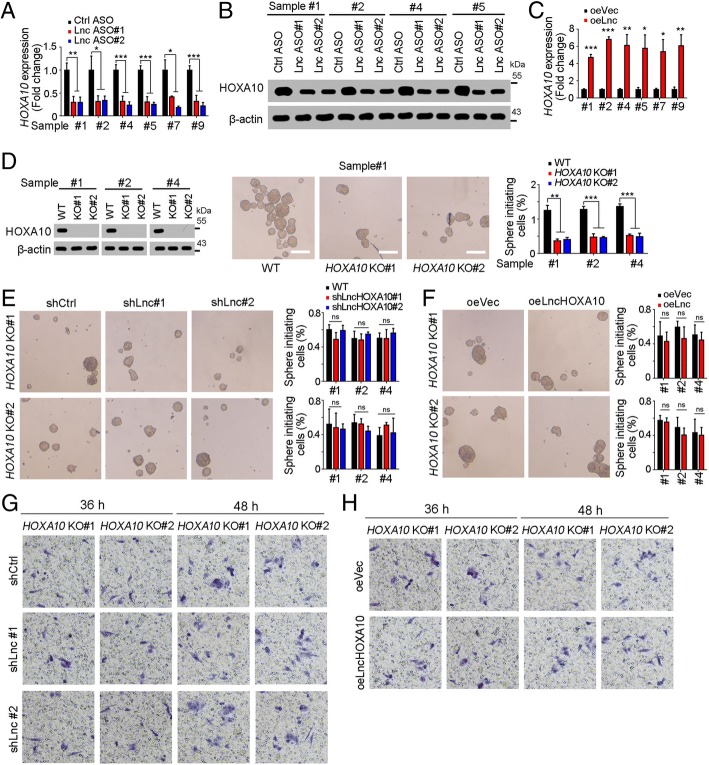
LncHOXA10 promoted HOXA10 expression. a, b HOXA10 expression levels in lncHOXA10 depleted cells were examined through realtime PCR (a) and Western blot (b). β-actin served as a loading control. c LncHOXA10 overexpressing cells were used for HOXA10 examination. d HOXA10 knockout cells were established through CRISPR/Cas9 approach, followed by sphere formation. Typical sphere images and sphere-initiating ratios were shown in middle and right panels, respectively. e, f LncHOXA10 was silenced (e) or overexpressed (f) in HOXA10 knockout cells, followed by sphere formation assay. LncHOXA10 had an impaired role in liver TIC self-renewal upon HOXA10 knockout. g, h HOXA10 knockout cells were used for lncHOXA10 knockdown (g) and overexpression (h), followed by transwell invasion assay. Invasive cells were detected at the indicated time points and typical images were shown. *P < 0.05; **P < 0.01; ***P < 0.001; ns, not significant, by one-tailed Student’s t test. Data are representative of three independent experiments

