Fig. 6.
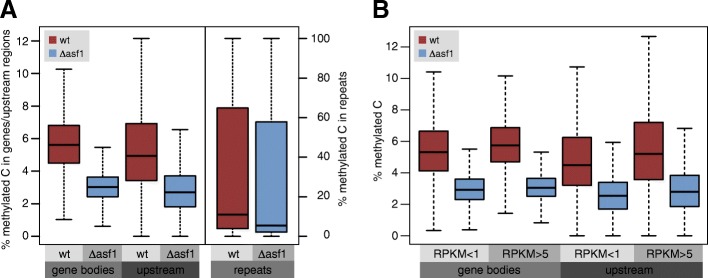
Analysis of cytosine methylation by bisulfite sequencing (BS-seq) in the wild type and Δasf1. a Methylated cytosines (at least 5% methylation for a cytosine to be counted as methylated) were counted within gene bodies (exons and introns of gene, i.e. the regions contained in the primary transcript), upstream regions (500 bp upstream of the annotated gene body), and annotated repeat regions. The boxplots show the distribution of the percentages of methylated cytosines, with median value as a horizontal line in the box between the first and third quartiles. Outliers were left out for better visibility. Student‘s t-test showed that mean values of wild type and Δasf1 are significantly different from each other for each group of features (gene bodies, upstream regions, repeats). b Boxplot of percentages of methylated cytosines in different subsets of genes. On the left, methylation within gene bodies was analyzed, on the right, methylation in upstream regions, in both cases for genes with RPKM values in the wild type of < 1 or > 5, respectively. Outliers were left out for better visibility. The median value is shown as a horizontal line in the box between the first and third quartiles. Student‘s t-test showed that for each RPKM group (< 1 or > 5), the wild type and Δasf1 mean values are significantly different from each other (p < 0.05)

