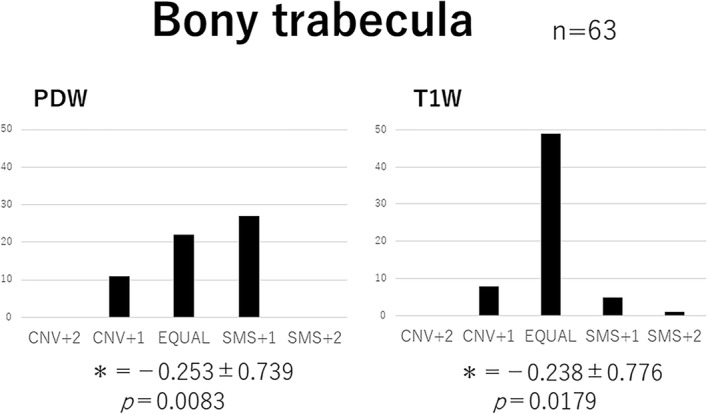
Fig. 8.

Visual image evaluation for the bony trabecula. Bar chart of the total score obtained from three readers. Wilcoxon signed-rank test values (MEAN ± SD:*) were as follows: PDW -0.253 ± 0.739 and T1W -0.238 ± 0.776. PDW and T1W for the bony trabecula by SMS were significantly superior to those by conventional methods. PDW: proton-density weighted; T1W: T1-weighted; SMS: simultaneous multi-slice; CNV: conventional; EQUAL: equal
