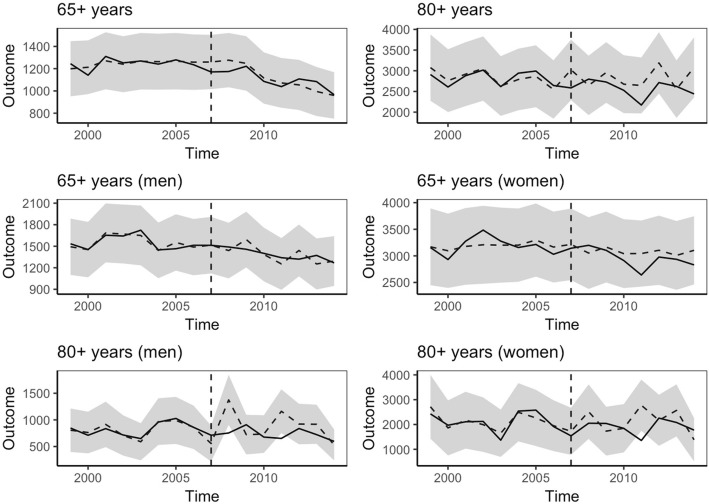
Fig. 1.
Caption: Trends in hip fracture incidence across age and gender in treatment and matched control municipalities. Notes: Estimated effects of the intervention on the number hip-fractures per 100.000 person-years in Norwegian municipalities in six different subgroups. The solid line is the treatment group, and the dashed line is the control group. The shaded area shows a 95% confidence interval assuming a Poisson distribution

