Fig. 2.

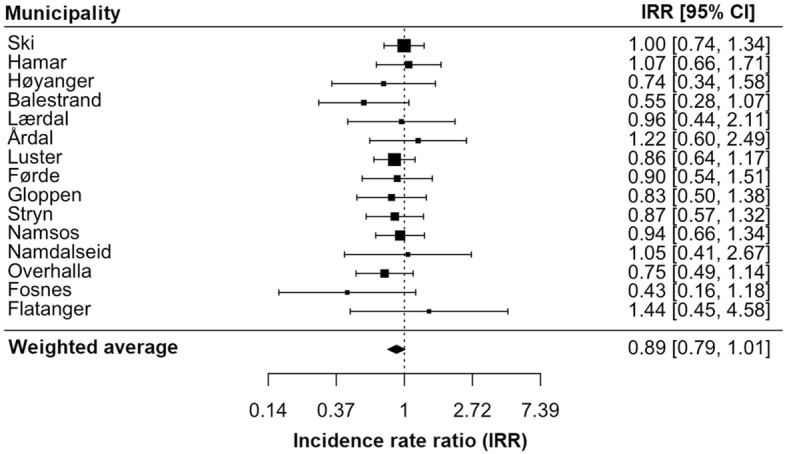
Caption: Forest plot of the estimated municipality-specific relative effects in the 15 treated municipalities. Notes: Point estimates are shown in boxes, along with 95% confidence intervals

Caption: Forest plot of the estimated municipality-specific relative effects in the 15 treated municipalities. Notes: Point estimates are shown in boxes, along with 95% confidence intervals