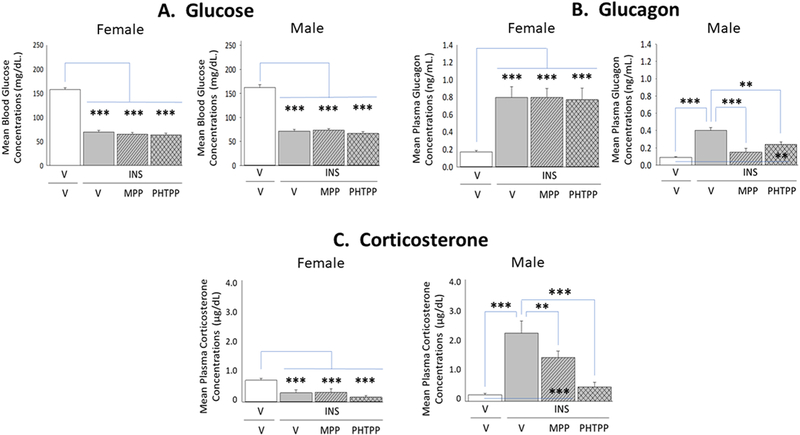
Figure 6. Impact of MPP or PHTPP Pretreatment on Insulin-Induced Hypoglycemia and Counter-Regulatory Hormone Secretion in Female versus Male Rats.

Data show circulating glucose [Panel A; female data at left, male data at right], glucagon [Panel B; female data at left, male data at right], and corticosterone [Panel C; female data at left, male data at right] levels in groups of groups of vehicle-pretreated eu-(solid white bars) and hypoglycemic (solid gray bars) animals and MPP-(diagonal-striped bars) or PHTPP (cross-hatched gray bars)-pretreated INS-injected rats. Bars depict for each sex mean concentrations ± S.E.M. for each treatment group.
