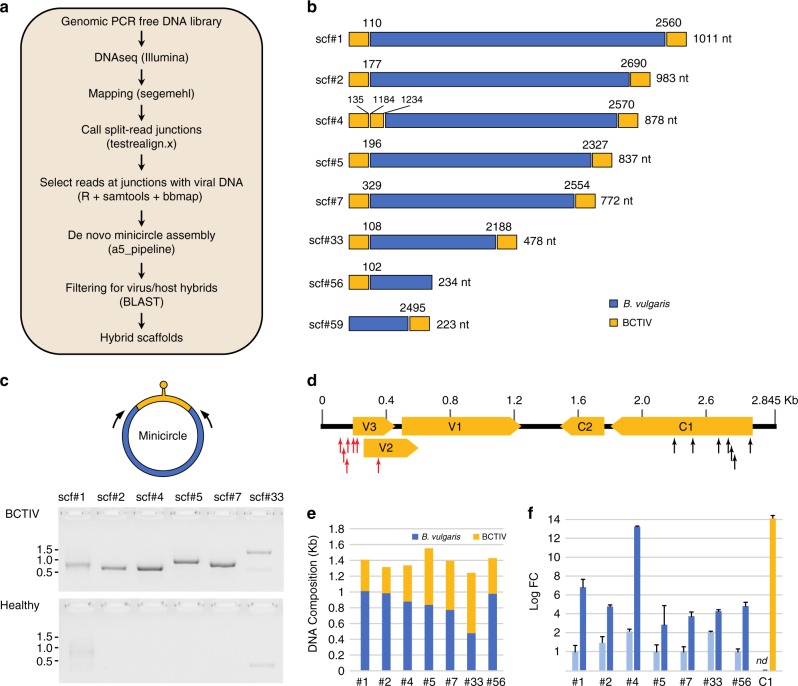
Fig. 2.
Identification of minicircles in experimentally infected Beta vulgaris plants by the NGS approach. a Diagram of the bioinformatic pipeline used for the detection of minicircles. The tools used in each step are indicated in parentheses (refer to the Methods section for details). b Schematic representation of the eight BCTIV/Beta vulgaris hybrid scaffolds assembled after the filtering step described in a. The junction coordinates referring to the BCTIV genome are indicated above each recombination point. The sizes (nt) of the B. vulgaris DNA fragments (blue portions) are reported on the right. c In vivo validation of the circular nature of the scaffolds reported in b, performed by inverse PCR (see also Supplementary Figure 3). The approximate positions of the primers specific for the non-viral portions of each minicircle (in blue) are indicated by arrows. DNA from mock-inoculated B. vulgaris was used as a negative control. Molecular markers (kb) are shown on the side. Source data are provided as Supplementary Data 5. d Distribution of minicircle junctions between viral and host DNA. The proximal and distal junctions are marked with red and black arrows, respectively. BCTIV ORFs are represented by yellow boxes. e Relative contributions of B. vulgaris and BCTIV DNA to minicircles identified by NGS. f Relative increase in copy number of chromosomal DNA fragments due to their amplification as parts of minicircles in the BCTIV-infected plant. Copy number was determined by quantitative PCR and normalized to a single copy gene (GAPDH). Light-blue bars represent healthy plants and dark-blue bars BCTIV-infected plants. BCTIV copy number was estimated by amplification of a fragment of the C1 ORF (yellow bar). Each bar represents the mean of three repetitions; ±s.d. marked by error bars; nd not detected. Source data are provided as Supplementary Data 5

