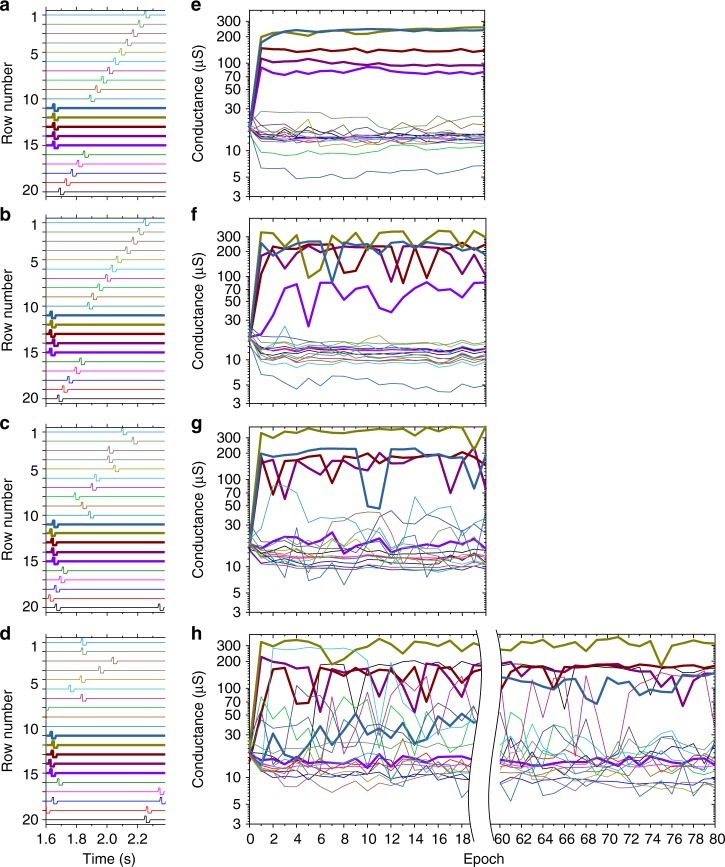
Fig. 4.
Coincidence detection of higher-noise pattern. a–d Example of specific spiking input frame with a (tjitter)max = 0, (Δoffset)max = 0, b (tjitter)max = 27 ms, (Δoffset)max = 27 ms, c (tjitter)max = 27 ms, (Δoffset)max = 216 ms, and d (tjitter)max = 27 ms, (Δoffset)max = 432 ms and e–h corresponding results for time evolution of all devices’ conductances involved in the experiment. A single data point on right panels corresponds to the conductance measured at the end of a particular epoch. For all experiments, pspike = 1. All inputs and corresponding conductances are shown using unique colours. Thicker lines show synchronous inputs/weights

