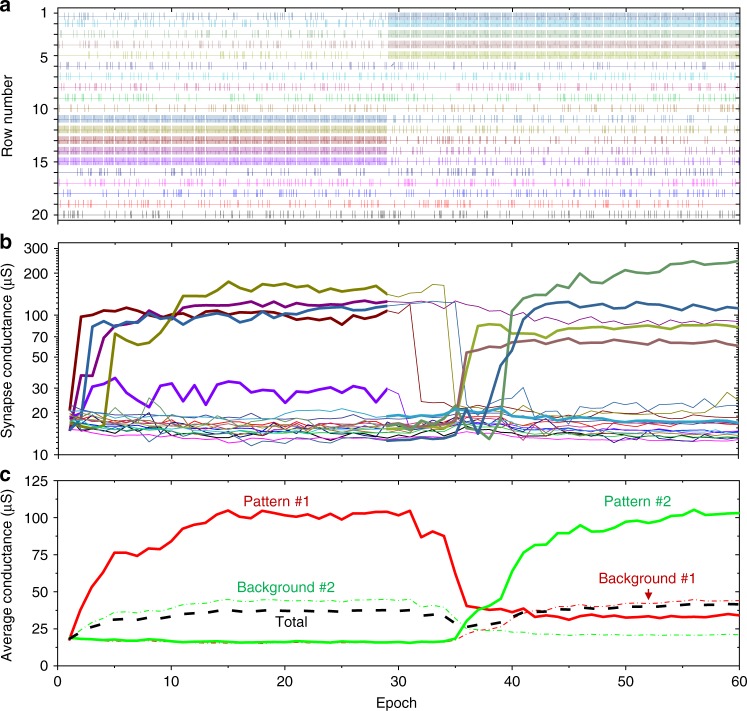
Fig. 5.
Coincidence detection of two lower-noise patterns. a A spiking input with pspike = 0.2, (tjitter)max = 5 ms, (Δoffset)max = 500 ms. The first pattern of synchronous spikes was applied to the rows #11 through #15 in the first 30 epochs, while the second pattern was applied to rows #1 through #5 in the last 30 epochs. b Time evolution of all devices’ conductances involved in the experiment. c Post-processed results from panel b, showing time evolution of the total and the averaged conductances for all devices and the averages of subsets corresponding to the synchronized (pattern #1 and pattern #2) and noise inputs. The colour coding in panels a and b are similar to those of Fig. 4

