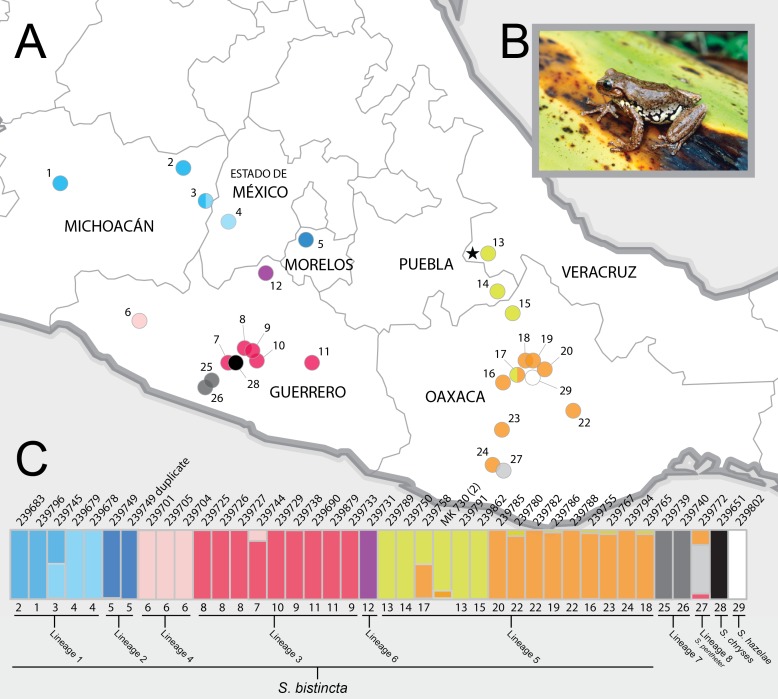
Figure 1. Sampling sites and Structure plots.
(A) Map of central Mexico showing sampling sites for S. bistincta and close outgroups, with numbers matching localities listed in Table 1 and colors matching Structure results below. Unsampled parts of the distribution of S. bistincta are shown in Fig. S1. Star indicates the type locality; (B) S. bistincta individual from near site 1 (recently described as a new species, S. hapsa, see text); (C) Composite results of repeated Structure runs at K = 2 showing the finest detectable structure in the genetic data. Each vertical line represents an individual labeled with its UMMZ catalog number above and, the site number and the lineages indicated by the species delimitation SNAPP analysis. One tissue voucher MK 730 (2) could not be linked to a specimen voucher and thus its geographic locality is unknown. Photo credit: Peter Heimes.

