Figure 2.
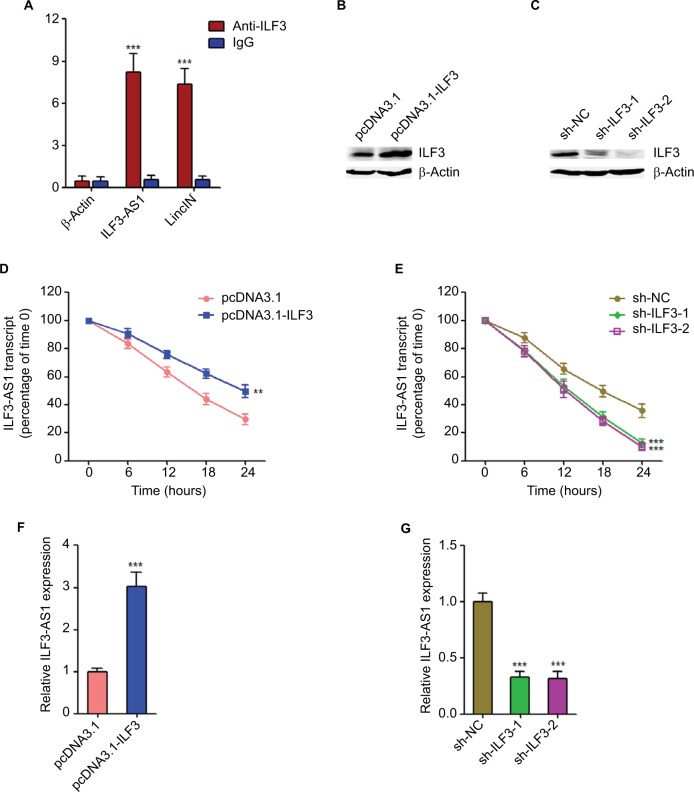
ILF3 physically binds and increases the stability of ILF3-AS1 transcript.
Notes: (A) RIP assays followed by qRT-PCR revealed the specific enrichment of ILF3-AS1 with ILF3-specific antibody compared with nonspecific IgG. β-Actin mRNA was used as a negative control. LincIN was used as a positive control. (B) Forty-eight hours after transiently transfecting ILF3 overexpression plasmid into SK-MEL-2 cells, ILF3 protein levels were determined by Western blot. (C) Forty-eight hours after transiently transfecting two independent ILF3-specific shRNAs into A375 cells, ILF3 protein levels were determined by Western blot. (D) Forty-eight hours after transiently transfecting ILF3 overexpression plasmid into SK-MEL-2 cells, the cells were treated with 50 µM α-amanitin to block new RNA synthesis, and then, the stability of ILF3-AS1 transcript over time was determined by qRT-PCR. 18S rRNA, a product of RNA polymerase I that is unchanged by α-amanitin, was used as endogenous control. (E) Forty-eight hours after transiently transfecting two independent ILF3-specific shRNAs into A375 cells, the cells were treated with 50 µM α-amanitin to block new RNA synthesis and, then, the stability of ILF3-AS1 transcript over time was determined by qRT-PCR. 18S rRNA, a product of RNA polymerase I that is unchanged by α-amanitin, was used as endogenous control. (F) Forty-eight hours after transiently transfecting ILF3 overexpression plasmid into SK-MEL-2 cells, ILF3-AS1 transcript levels were determined by qRT-PCR. (G) Forty-eight hours after transiently transfecting two independent ILF3-specific shRNAs into A375 cells, ILF3-AS1 transcript levels were determined by qRT-PCR. Results are presented as mean ± SD based on at least three independent experiments. **P<0.01; ***P<0.001 by Student’s t-test (A, D, and F) or one-way ANOVA (E and G).
Abbreviations: qRT-PCR, quantitative real-time PCR; RIP, RNA immunoprecipitation.

