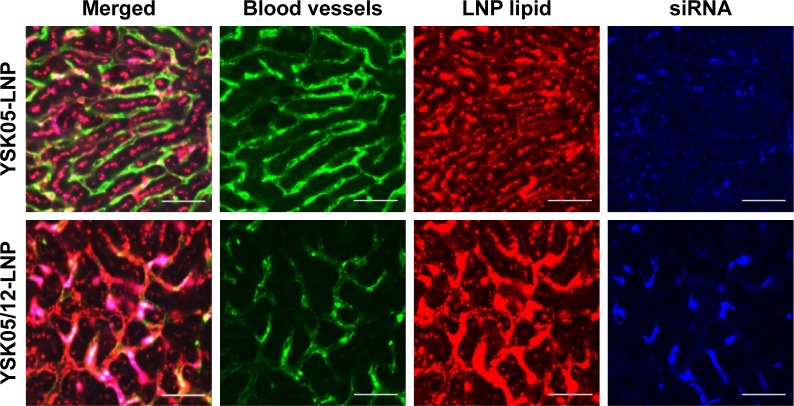
Figure 6.
Intrahepatic distribution of YSK05-LNP (pKa 6.50) and YSK05/12-LNP (pKa 7.15).
Notes: Mice were intravenously injected with DiI-labeled LNPs encapsulating a mixture of siRNA (siGL4:siCy5-GFP 1:1 ratio) at a dose of 0.5 mg/kg of both siRNAs. After 1 hour, liver tissues were collected and the distribution of LNPs was observed by CLSM. Green color represents blood vessels/LSECs (FITC-Isolectin B4), red color represents LNP (DiI), and blue color represents siRNA (Cy5). Scale bars: 50 µm.
Abbreviations: CLSM, confocal laser scanning microscopy; FITC, fluorescein isothiocyanate; GFP, green fluorescent protein; LNP, lipid nanoparticle; LSECs, liver sinusoidal endothelial cells; siRNA, short interfering RNA.

