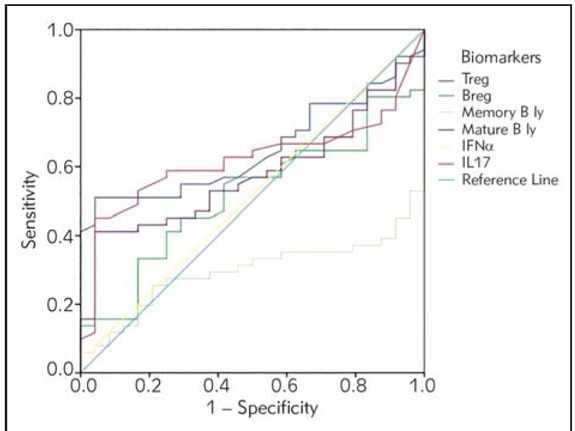
Figure 1.

Receiver operating characteristic (ROC) curve of potential biomarkers for differentiation between SLE group and healthy controls. The smallest cut-off value was the minimum observed test value minus 1, and the largest cutoff value was the maximum observed test value plus 1. All the other cut-off values were the average of two consecutively ordered observed test values.
