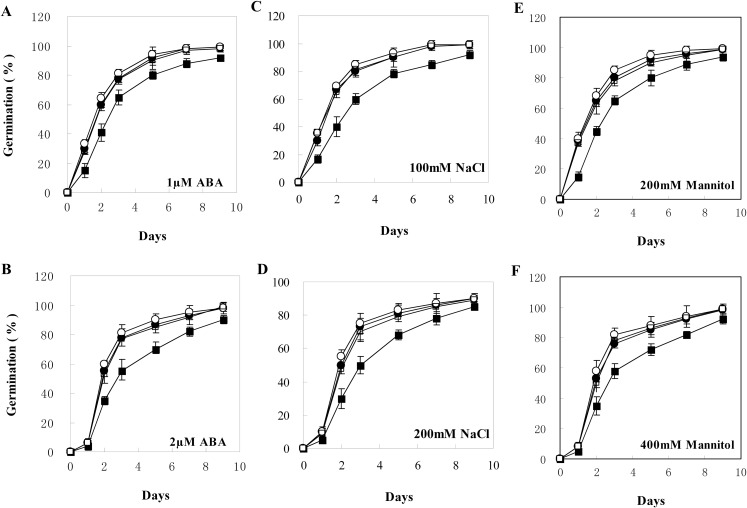
Figure 5. Seed germination of wild type and transgenic lines on MS with different levels of ABA, NaCl, or Mannitol.
(A–F) Seed germination on MS with one μM ABA, two μM ABA, 100 mM NaCl, 200 mM NaCl, 200 mM Mannitol, and 400 mM Mannitol, respectively. The black squares, black circles, and white circles, and white squares represented wild type, TL2, and TL4, and TL7 transgenic line, respectively. Data represent the mean values with standard errors of three replicates.

