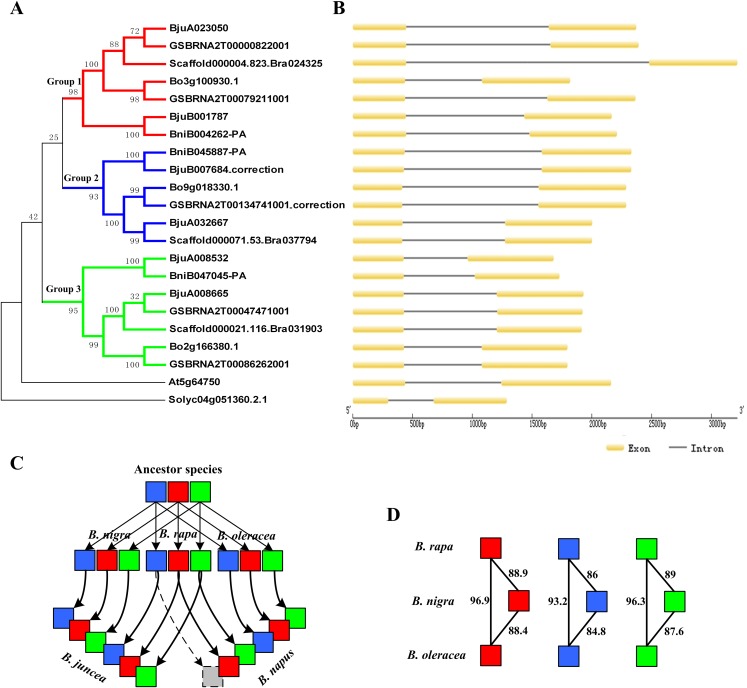
Figure 7. Phylogenetic relationship and gene structure of ABR1 homologous genes.
(A) A phylogenetic tree of 22 ABR1 homologous genes constructed on the basis of NJ method with a bootstrap value of 1,000 using MEGA5.1. Solyc04g051360.2.1 gene of Solanum lycopersicum was the outgroup gene. The genes in red, blue, and green branches belonged to group 1, 2, and 3, respectively. (B) Exon-intron structure of ABR1 homologous genes. (C) Evolutionary trajectory of ABR1 homologous genes in Brassica species. Red, blue, and green squares represented the genes in group 1, group 2, and group 3, respectively. The gray square indicated that the gene was lost in B. napus. The arrows represented evolutionary trajectory of genes among Brassica species. (D) The amino acid sequence similarity percentage among ABR1 homologous genes of the three diploid Brassica. Red, blue, and green squares represented the genes in group 1, group 2, and group 3, respectively. The number near the black line linking two squares represented the sequence similarity percentage between the two genes.

