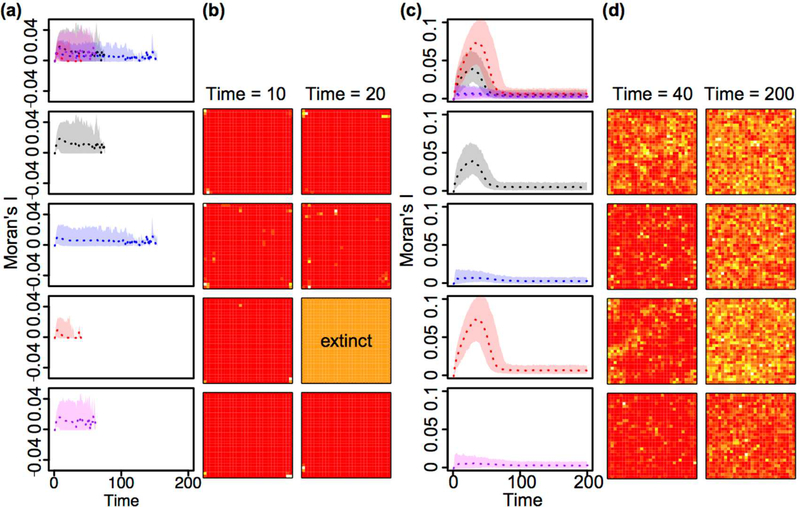
Fig. 2. Projected spatial clustering of aphids on a 30X30 torus.
Plotted are the means (dotted line), and 95% quantile confidence bands of Moran’s I for n=1000 simulations of the coupled lattice model assuming a 30X30 spatial grid on a torus using parameters estimated from treatments where aphids had low (a) or high dispersal (c) and no natural enemies (black, second row), or while in the presence of the following natural enemies: entomopathogenic fungus only (blue, third row), ladybird beetle only (red, fourth row), and fungus and beetle combined (purple, fifth row). In top row, all plots are overlaid to show differences between treatments. Example spatial plots for low (b) or high dispersal (d) show different levels of clustering for treatments (corresponding with rows in a and c) at time 10 and 20 for low dispersal treatments and at time 40 when clustering peaks for beetle only treatment and equilibrium, time 200 for high dispersal treatments. White colors correspond to larger, and red to lower population sizes of aphids. A completely orange lattice indicates population extinction. Moran’s I > 0 indicates clustered, < 0 indicates dispersed and 0 = random spatial patterns.

