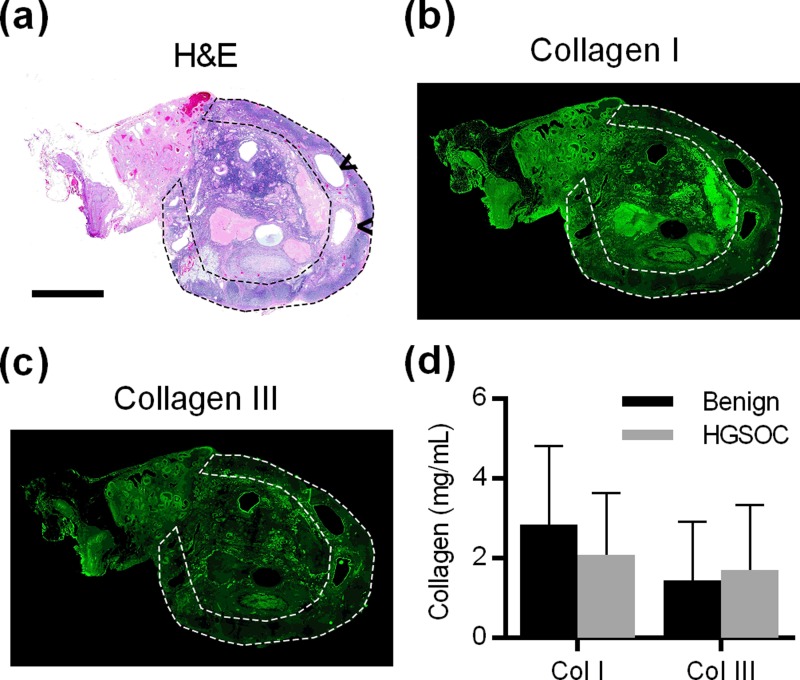
FIG. 2.
(a) H&E stain of human ovary; arrowheads indicate the CICs, and dotted line highlights the cortex (Scale bar = 5 mm). [(b), (c)] IMF showing the distribution of collagen I and III in the ovary and cortex for the same ovary as in (a). (d) Quantification of collagen I and III in the ovarian cortex, n = 10 per condition, not significantly different by the two-sided t-test.

