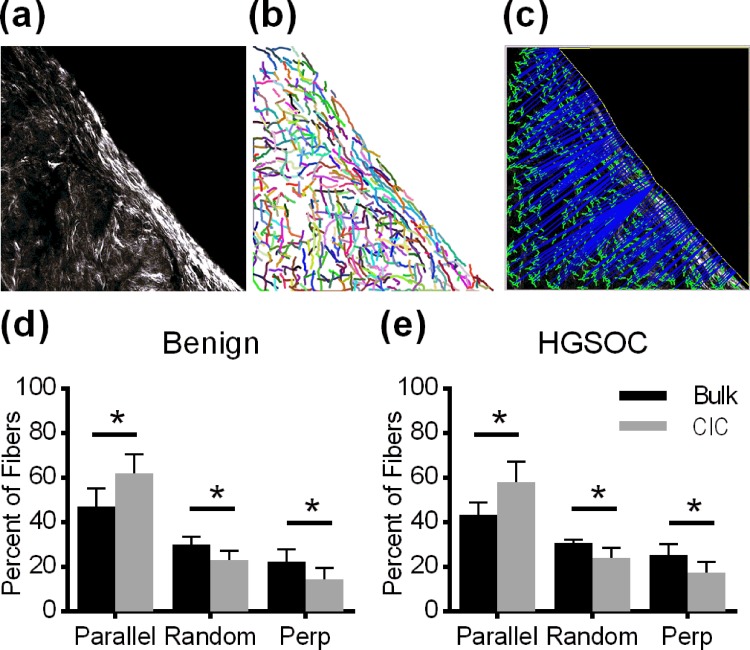
FIG. 4.
(a) Collagen Specific Second Harmonic Generation image of collagen at the CIC boundary (Scale bar = 20 μm). (b) CT-FIRE identification of collagen fibers. (c) CurveAlign image identifying the angle and distance from the boundary for each fiber. [(d)–(e)] Collagen fibers at the CIC boundary were significantly more aligned to the boundary compared to stromal fibers in both benign (n = 10) and HGSOC (n = 13) patients. Data are an average of the alignment percentages found in each CIC, n = 904–6544 fibers per CIC, and p < 0.001 between the CIC boundary and bulk by a two-sided t-test.

