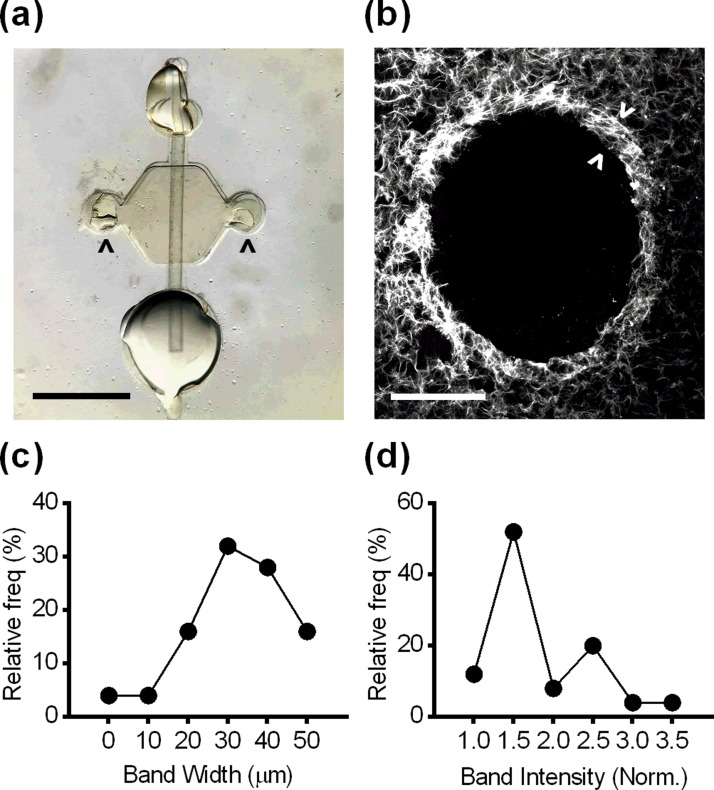
FIG. 5.
(a) Microfluidic lumen with a small port (top), a large port (bottom), side ports (arrowheads), and a lumen rod (Scale bar = 2 mm). (b) Collagen formed a dense band (arrowheads) surrounding lumens in the in vitro model (Scale bar = 200 μm). (c) Histogram of the width of the collagen band. (d) Histogram of the normalized fluorescence intensity of the collagen band. For [(c) and (d)], data are presented as frequency distributions, n = 25 lumens.

