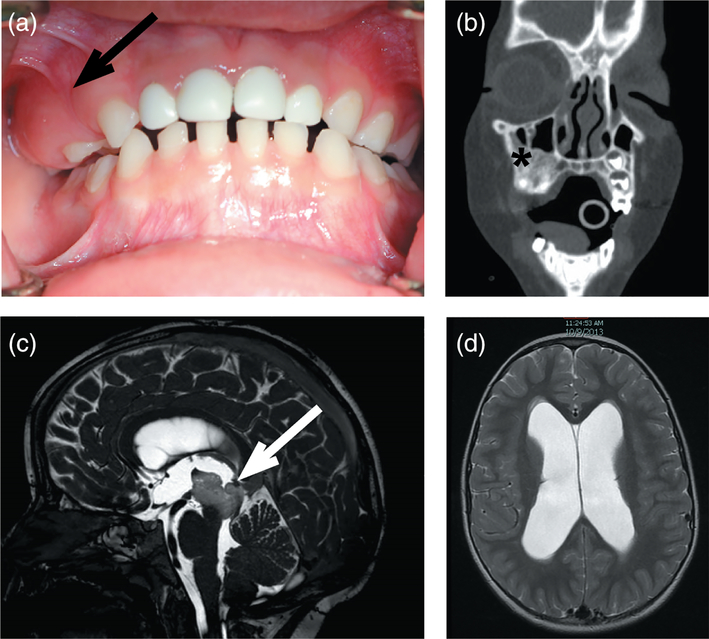
FIGURE 1.
Maxillary lesion and brain stem mass in MOS100. (a) Expansion of the maxillary bone was noted on routine dental examination (arrow). (b) Coronal CT demonstrated an area of dysplastic bone with a mostly sclerotic appearance (asterisk). (c) T2 sagittal MRI of the brain identified a central, soft tissue mass (arrow), which on biopsy was found to be a low-grade astrocytoma, and (d) associated hydrocephalus in the lateral ventricles [Color figure can be viewed at wileyonlinelibrary.com]

