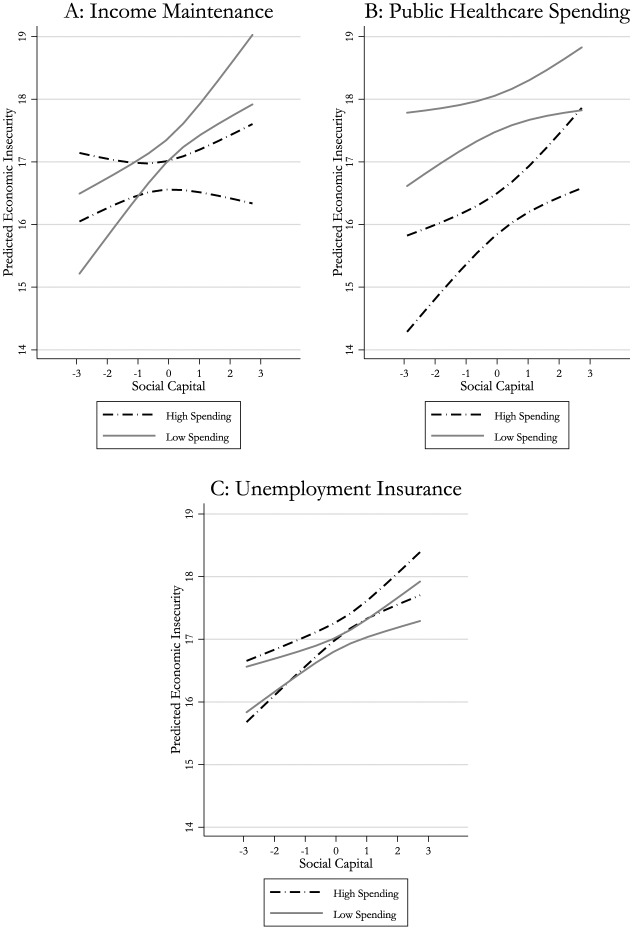
Figure 3.
Short-run effects of social capital.
Note. Each graph reports 95% confidence intervals for predicted economic insecurity as the percentage of state population with a net household income loss of at least 25% relative to the previous year. Marginal estimates are obtained using coefficients from Model 2 in Table 2 while holding other variables not specifically labeled in each subfigure constant at their sample mean, including the lagged dependent variable term. “High” and “Low” values are defined by the 10th and 90th in-sample percentiles, respectively, of each spending measure.

