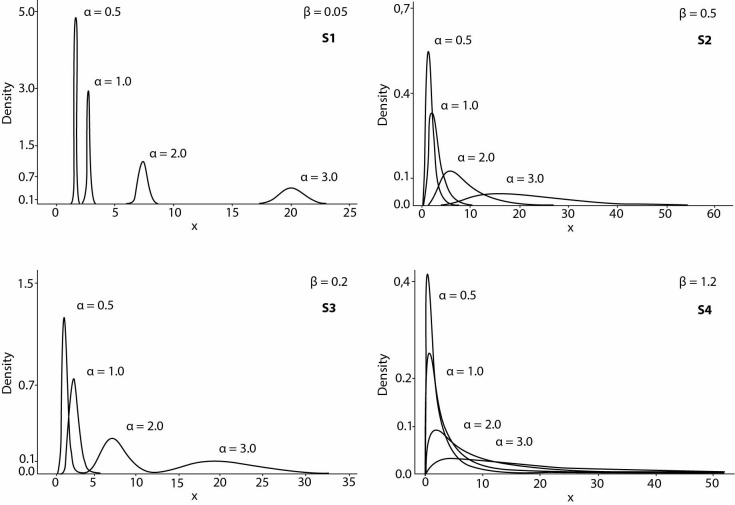
Figure 1.
Theoretical frequency distribution of the simulated data generated by the 3-parameter lognormal probability density function. By varying scale (β) and location (α) parameters with threshold (γ) fixed at 0 it is possible to reproduce different combinations of asymmetry, tailing and kurtosis (flatness) that give rise to the testing conditions described in the result section as S1 - S4. In general, increasing α gives more flatness to the shape while β more asymmetry, whereas γ relatively affects the degree of left-fronting since it constrains the distribution of data to a certain lower bound.

