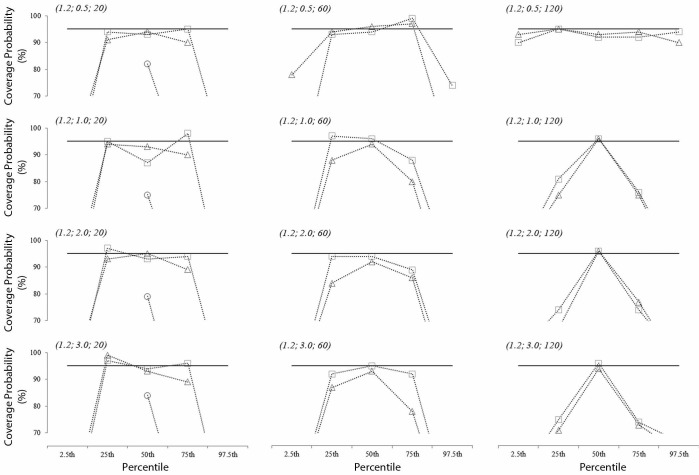
Figure 5.
Actual coverage probability in left-fronted model of data with left fronting (S4). The coordinates in brackets (β;α;) represent scale (β) and location (α) parameters of the lognormal distribution (with 0 threshold) generating the artificial data for a given sample size (n). The solid black line shows the desired coverage probability (95% in this case) that is achieved when the symbol representing the parametric-CI (circle), nonparametric-CI (square) or BCa-CI (triangle) lays on it.

