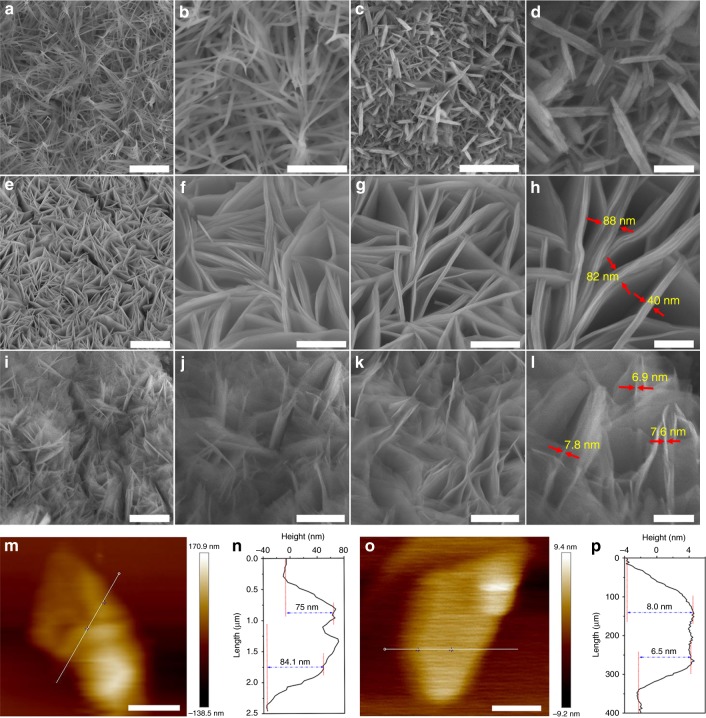
Fig. 2.
SEM images of LDH/NF samples. a Low-magnification and b high-magnification SEM images of CLDH/NF. Scale bars: a 2 μm; b 500 nm. c Low-magnification and d high-magnification SEM images of ILDH/NF (recorded at different areas). Scale bars: c 1 μm; b 200 nm. e–l SEM images of e–h pristine ICLDH/NF and i–l e-LDH@GDY/NF (recorded at different areas). Scale bars: e 2 μm; f, g, j, k 500 nm; i 1 μm; h, l 200 nm. AFM images and height profiles of m, n ICLDH nanosheets and o, p e-LDH@GDY nanosheet, respectively. Scale bars: m 1 μm; o 150 nm

