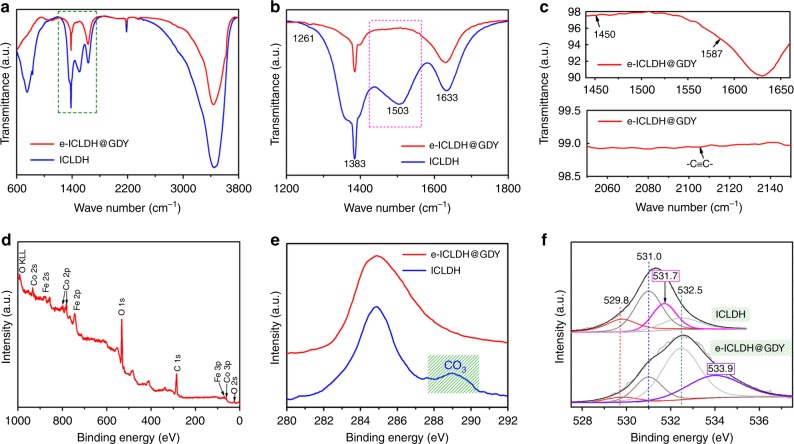
Fig. 4.
Structural characterization of electrocatalysts. a FTIR spectra of the e-ICLDH@GDY/NF (red line) and pristine ICLDH/NF (blue line) structures. b Enlarged image of the selected area of the FTIR spectrum in a. c Selective enlargement of the FTIR spectra of e-ICLDH@GDY/NF. d XPS survey spectrum of e-ICLDH@GDY/NF. e, f Core-level XPS spectra of the e C 1s and f O 1s binding energies of the e-ICLDH@GDY/NF and pristine ICLDH/NF electrocatalysts

