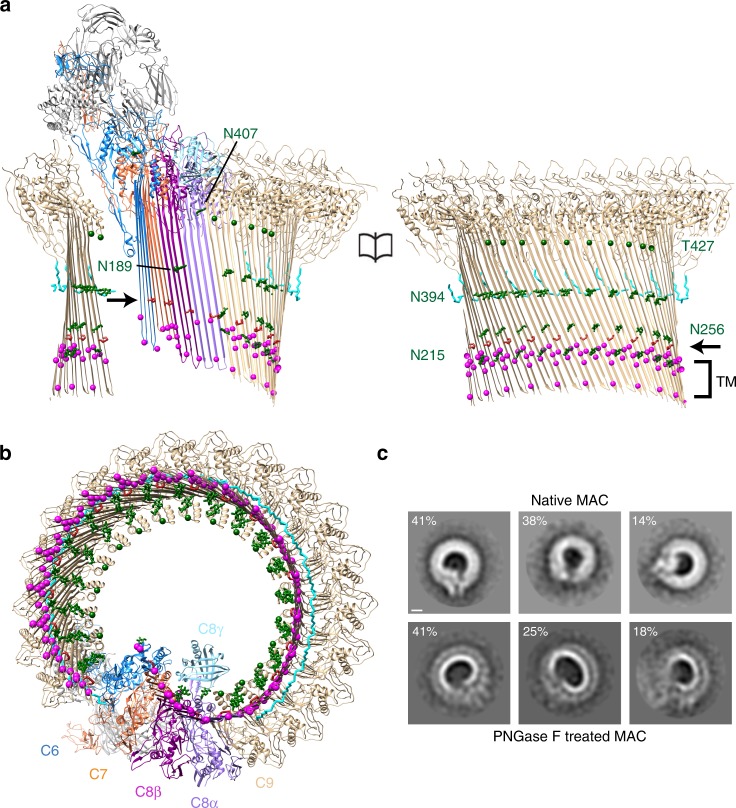
Fig. 2.
Glycans provide structural support for a giant β-barrel. Molecular model for the open conformation as viewed from within the β-barrel (a) and from the membrane (b). N-linked glycans (green) are shown as sticks (C9:N215, N256, N394; C8β:N189; and C8α:N407). Cα carbons of O-linked C9:T427 are represented as green spheres. Backbone trace of C9 C-terminus (res 522:535) is shown as cyan sticks. Disulfide bonds within MACPF domains are red and indicated by an arrow. Cα carbons of aromatic residues near the membrane (TM) are magenta spheres. c Reference-free 2D class averages of negatively stained MAC assembled from de-glycosylated C8 and C9 (bottom panel) show distorted pores on lipid monolayers as compared to native MAC (top panel). Classes are derived from similar particle numbers to enable a more direct comparison of curvature distortion (native, 706; de-glycosylated, 711). Native MAC particles are a randomly chosen subset of the data shown in Supplementary Fig. 2a which include variations across open and closed conformations. Percentage of particles belonging to each class is indicated. Scale bar, 50 Å

