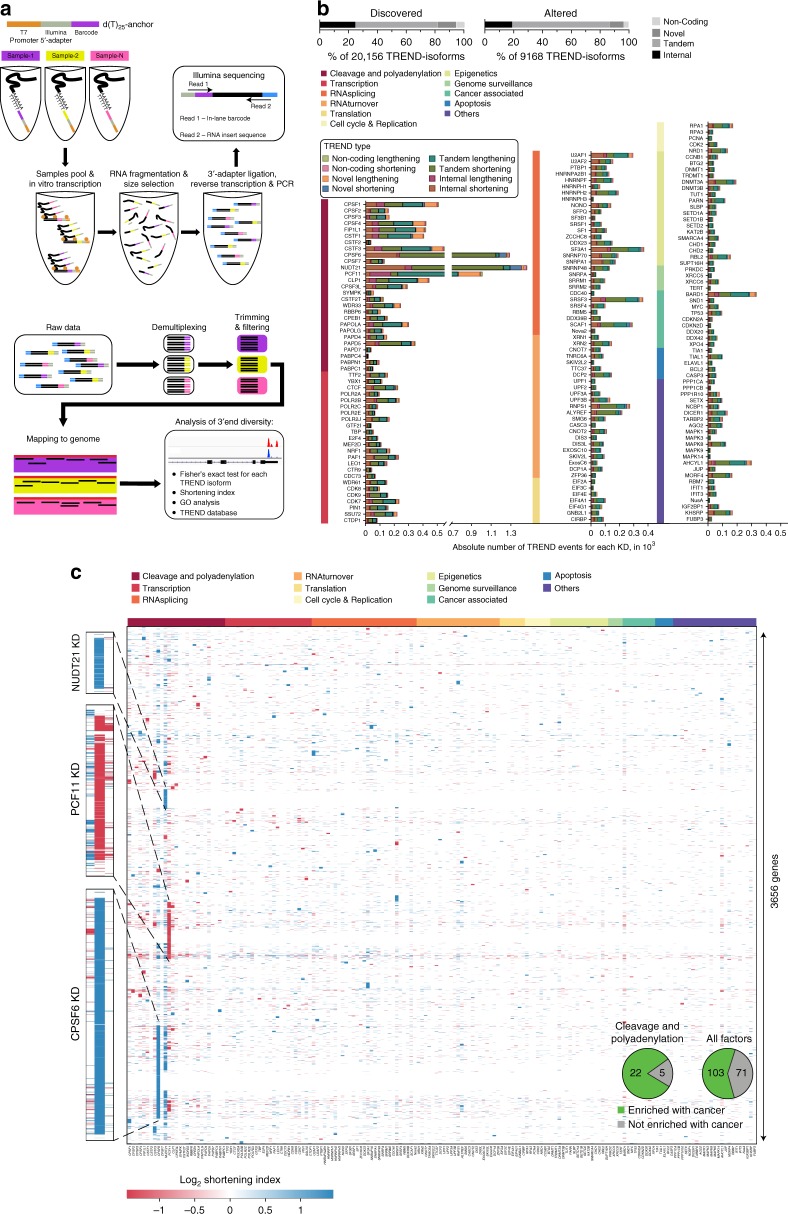
Fig. 2.
Massive RNAi screening reveals key regulators of TREND in neuroblastoma with a potential role in tumorigenesis. a TRENDseq library preparation (top) and bioinformatical pipeline (bottom) for highly multiplexed genome-wide analysis of the TREND-landscape. The Integrated Genomics Viewer (IGV) of two sequence read alignments (lower right corner) illustrates two distinct TREND-phenotypes that correspond to a more prevalent distal (condition shown in red; reflecting ‘lengthening’ compared to the respective other condition) or proximal polyadenylation (condition shown in blue; reflecting ‘shortening’ compared to the respective other condition), respectively. b Relative proportion of TREND types discovered in neuroblastoma BE(2)-C (upper left diagram), and isoforms effectively altered upon RNAi depletion of at least 1 out of 174 putative TREND regulators (upper right diagram). ‘Tandem’ and ‘Internal’ events affect annotated 3′ UTRs or protein C termini, ‘Novel’ assign transcript isoforms exceeding the annotated gene 3′ end and ‘Non-coding’ depict TREND alterations affecting non-coding RNAs. Individual TREND regulation per RNAi candidate is shown in the bar diagram (the colour code indicates the functional category to which the depleted factor belongs to, see also Supplementary Table 2). c Landscape of TREND upon RNAi (KD knockdown) of 174 individual putative TREND regulators (x-axis; functional categories to which the RNAi candidates belong to are the same indicated for b; see Supplementary Figure 2a). Each spot in the heat map reflects a gene significantly affected by TREND (the colour code in the heat map indicates the directionality of TREND; for example, a negative shortening index indicates a relatively more prevalent lengthened transcript isoform expressed by the respective gene upon depletion of the respective TREND regulator). Inlet: pie chart showing overrepresentation of cancer-associated genes affected by TREND upon depletion of 3′end processing components (for individual p-values see Supplementary Table 3)

