Fig. 1.
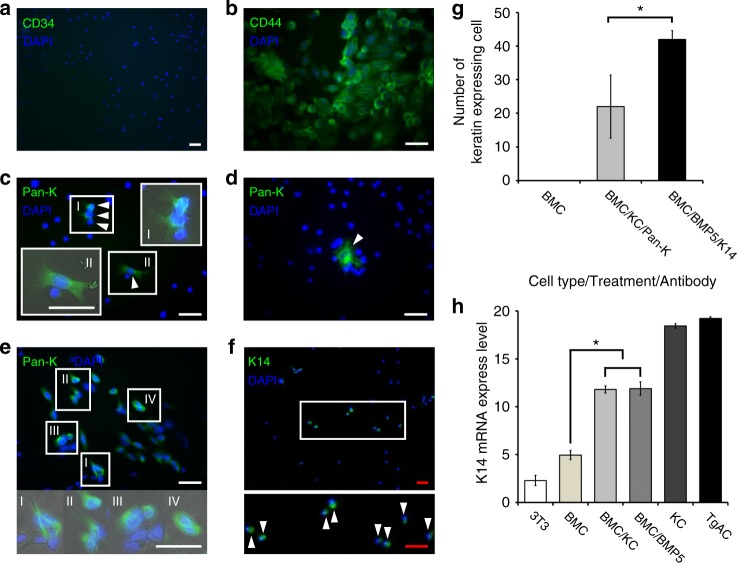
CD34−, CD44+ BMCs express keratin after BMC/KC co-culture and BMP5 treatment. a, b All adherent BMCs are CD34-negative and CD44-positive. c, e A sub set of adherent BMCs are pan-keratin-immunoreactive (arrowheads) after 7days of BMC/KC co-culture (keratin-positive BMCs in white boxes are magnified and merged with phase image). d Pan-keratin-immunoreactive BMC (arrowhead) identified 10 days after BMP5 treatment. f K14-immunoreactive cells (arrowheads) 10 days after BMP5 treatment (white box area is magnified). g Histogram of number of keratin-expressing BMCs; BMCs without treatment, BMC/KC co-culture (pan-keratin-positive BMCs, gray bar) and BMP5 treatment (K14-positive BMCs, black bar), pan-keratin- and K14-immunoreactive BMCs are detected in KC co-cultured and BMP5-treated BMCs, but no keratin-positive cells are detected in treatment controls (n = 3, 3 different culture groups, 3 male and 3 female mice in each group; P < 0.017 as determined by Student’s t-test, mean ± s.d.) h Q-RT-PCR results show the relative level of K14 expression detected from positive (primary KCs and Tg.AC, a KC cancer cell-line) and negative (Swiss mouse 3T3 cell-line and primary BMCs) control groups, and experimental (BMC/KC co-culture and BMP5 treatment) groups. The expression levels were normalized to GAPDH expression levels, and expression mean values were converted into fold-change gene expression. Final values were normalized with log2 transformation. (n = 3, P < 4.81 × 10E−12 as determined by Fisher’s ANOVA method, mean ± s.d.). *White scale bar, 50 µm; Red scale bar, 200 µm

