Fig. 6.
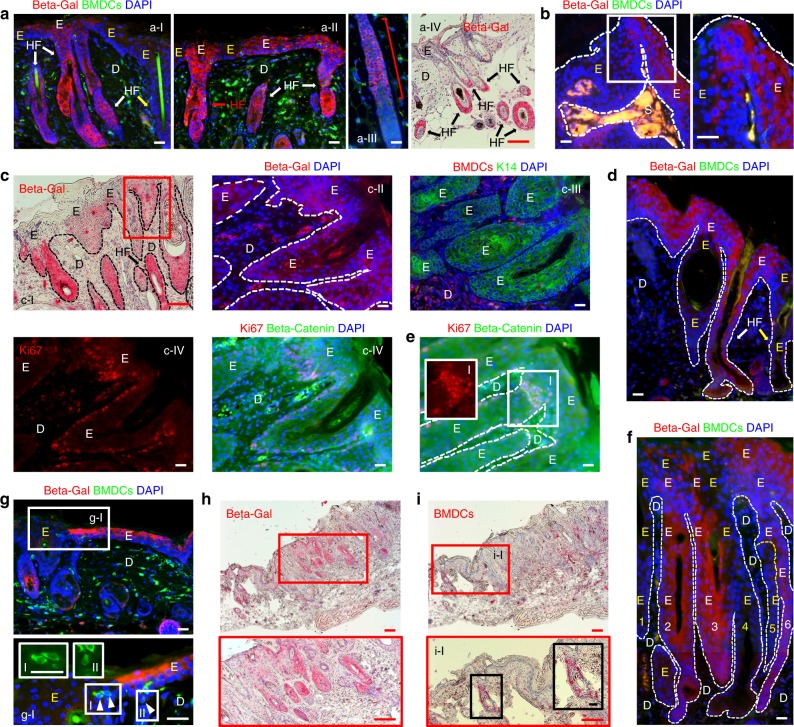
K15-positive bulge stem cells contribute to development of ulcer-associated dysplasia. a Contribution of K15-positive bulge stem cells (Beta-gal-positive) in hyperplastic epidermis. a-I Beta-gal-positive (white arrows and white E) and negative (yellow arrow and yellow E) HF are identified. a-II Beta-gal-positive cells are identified in HFs (red and white arrows) and interfollicular epidermis in hyperplastic epidermis. a-III Beta-gal-positive cells (red line) are identified in the bulge and lower HF in anagen. a-IV Beta-gal-positive cells (red IHC staining and black arrows) in HF bulge area and lower HF. b Contribution of Beta-gal-positive cells in papilloma epithelium. The junction of Beta-gal-positive and negative area (white box) is magnified. c Contribution of K15 bulge stem cells in dysplasia. c-II-IV Serial sections of red box area in c-I. c-I and c-II Beta-gal-positive cells are mainly located in the HF structure in dysplastic epidermis. c-III Serial sections show beta-gal-positive area is also K14-positive, and (c-IV) cytoplasmic beta-catenin expression with Ki67-positive cells located in basal region. d Beta-gal-positive cells located in both HF (white arrow) and interfollicular epidermis (white E) in dysplastic epidermis. e Ki67- and beta-catenin-expressing cells located in the neck region of dysplastic HF. f Cellular sources from six different dysplastic HFs (three beta-gal-positive, white E’s, and three beta-gal-negative, yellow E’s) participate in developing dysplastic interfollicular epidermis. g Beta-gal-positive cells (white E) and KC-shaped BMDCs (arrowheads) were observed together in hyperplastic interfollicular epidermis. White box area is magnified. g-I KC-shape BMDCs in white box-I and white box-II are magnified. h, i IHC of serial sections identified beta-gal-positive cells and BMDCs in close area of dysplastic epidermis. h Beta-gal-positive cells are in dysplastic HFs. Red box area is magnified. i A group of BMDCs were identified in a HF adjacent to dysplasia. Red box area is magnified. i-I Area of BMDCs is magnified further in black box. *Black and white scale bar, 50 µm; Red scale bar, 200 µm

