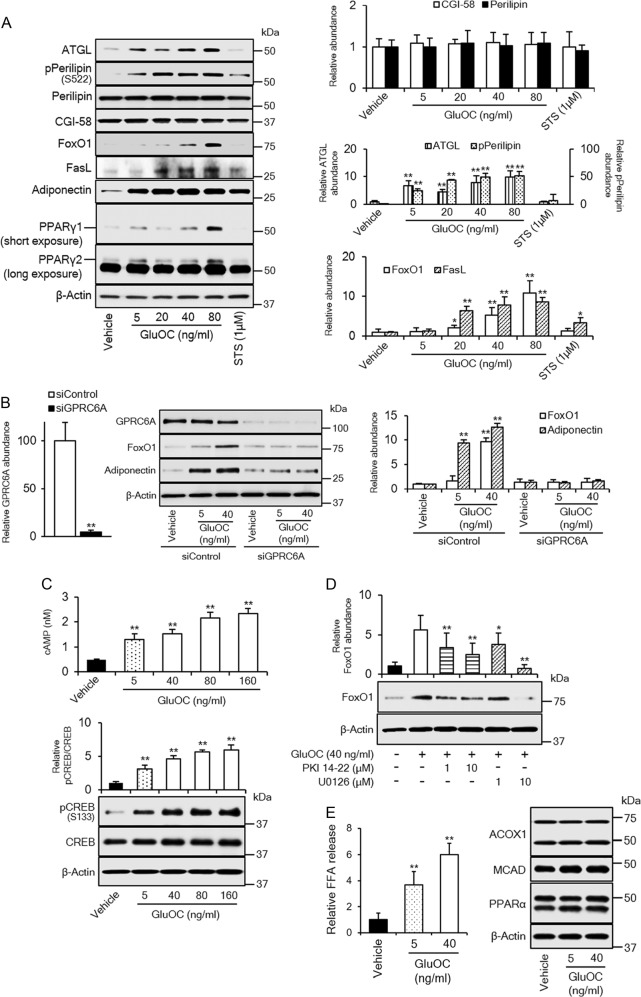
Fig. 2. Role of GPRC6A signaling in high-dose GluOC action in 3T3-L1 adipocytes.
a Cells were incubated with the indicated concentrations of GluOC or 1 μM staurosporine for 6 h, lysed, and subjected to immunoblot analysis of ATGL, total or Ser522-phosphorylated (p) forms of perilipin, CGI-58, FoxO1, FasL, adiponectin, and PPARγ. A representative blot, as well as quantitative data (means + SEM, normalized by the amount of β-actin or, in the case of phospho-perilipin, by the amount of total perilipin) from three independent experiments are shown. *p < 0.05, **p < 0.01 versus the corresponding value for control (vehicle-treated) cells (one-way ANOVA followed by the Tukey–Kramer HSD test). b Cells transfected with GPRC6A or control small interfering RNAs (siRNAs) were incubated with the indicated concentrations of GluOC for 6 h, lysed, and subjected to immunoblot analysis of GPRC6A, FoxO1, and adiponectin. A representative blot, as well as quantitative data (means + SEM, normalized by the amount of β-actin) from five independent experiments are shown. **p < 0.01 (Student’s t-test) versus the value for the cells transfected with the control siRNA (left panel); **p < 0.01 (two-way ANOVA followed by the Tukey–Kramer HSD test) versus the corresponding value for vehicle-treated cells transfected with the control siRNA (right panel). c Assay of cAMP in 3T3-L1 adipocytes incubated with the indicated concentrations of GluOC for 1 h (top panel), as well as immunoblot analysis of total and Ser133-phosphorylated forms of CREB in 3T3-L1 adipocytes incubated with the indicated concentrations of GluOC for 6 h (bottom panel). Quantitative data are means + SEM from five independent experiments. **p < 0.01 versus the corresponding value for control (vehicle-treated) cells (one-way ANOVA followed by the Tukey–Kramer HSD test). d Immunoblot analysis of FoxO1 in 3T3-L1 adipocytes incubated in the absence or presence of the indicated concentrations of myristoylated PKI 14-22 amide or U0126 for 1 h and then in the additional absence or presence of GluOC (40 ng/ml) for 6 h. A representative blot, as well as quantitative data (means + SEM, normalized by the amount of β-actin) from five independent experiments are shown. *p < 0.05, **p < 0.01 versus the value for cells exposed to GluOC alone (two-way ANOVA followed by the Tukey–Kramer HSD test). e Cells were incubated with the indicated concentrations of GluOC for 24 h, after which the amount of FFAs released into the culture medium was measured and cell lysates were subjected to immunoblot analysis of ACOX1, MCAD, and PPARα. Quantitative data are means + SEM from three independent experiments. **p < 0.01 versus the value for control (vehicle-treated) cells (one-way ANOVA followed by the Tukey–Kramer HSD test)

