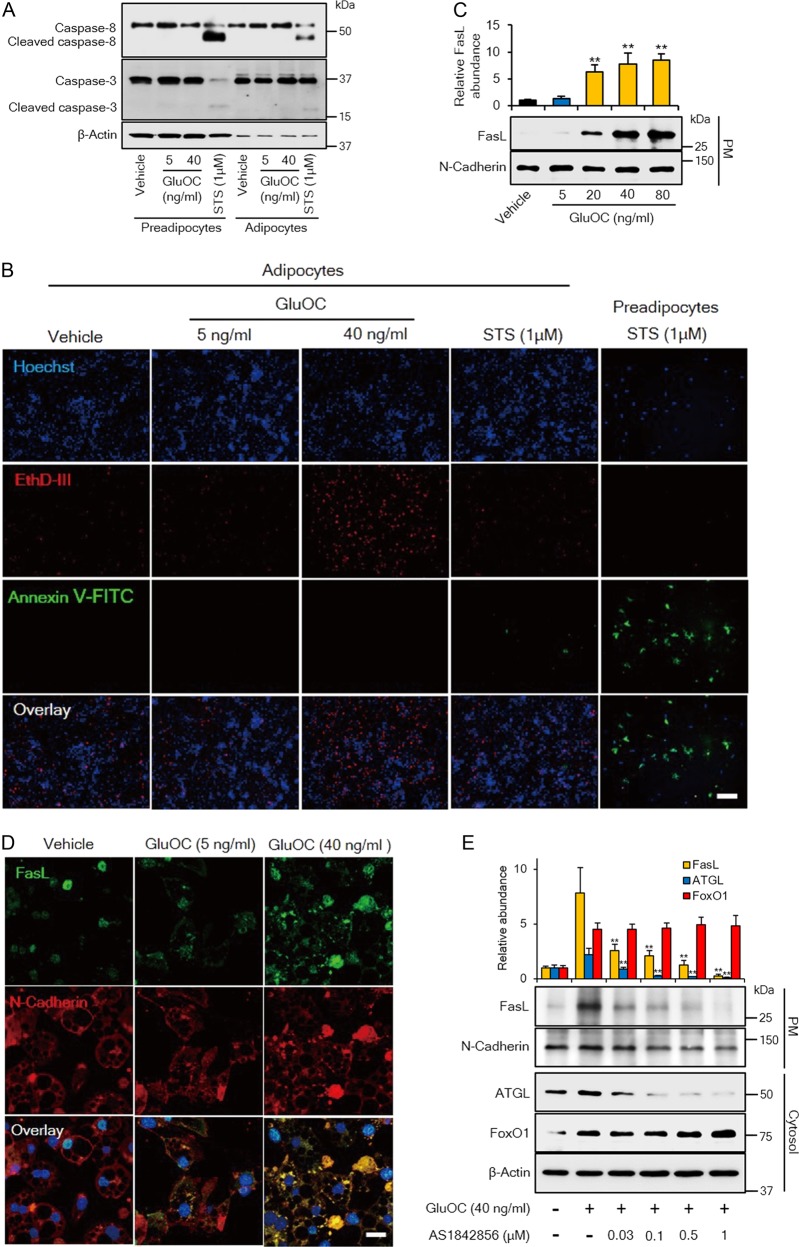
Fig. 4. Effects of high-dose GluOC on the expression and localization of FasL and consequent induction of necroptosis in 3T3-L1 adipocytes.
a Immunoblot analysis of caspase-8 and caspase-3 (cleaved or full-length) in 3T3-L1 adipocytes or preadipocytes incubated with the indicated concentrations of GluOC or with 1 μM staurosporine for 6 h. The blot is representative of four independent experiments. b Fluorescence microscopic images of 3T3-L1 adipocytes exposed to the indicated concentrations of GluOC or 1 μM staurosporine for 48 h, or of 3T3-L1 preadipocytes exposed to 1 μM staurosporine for 1 h. The cells were stained with Hoechst 33342 (blue), EthD-III (red), and FITC-conjugated Annexin V (green). Scale bar, 200 µm. The images are representative of five independent experiments. c Immunoblot analysis of FasL and N-cadherin (loading control) in the plasma membrane (PM) fraction isolated from 3T3-L1 adipocytes after incubation with the indicated concentrations of GluOC for 12 h. A representative blot, as well as quantitative data (means + SEM, normalized by the amount of N-cadherin) from three independent experiments are shown. **p < 0.01 versus the value for control (vehicle-treated) cells (one-way ANOVA followed by the Tukey–Kramer HSD test). d Confocal immunofluorescence analysis of FasL (green) and N-cadherin (red) in 3T3-L1 adipocytes exposed to the indicated concentrations of GluOC for 12 h. Nuclei are also stained with DAPI (blue) in the overlay images. Scale bar, 20 µm. Images are representative of three independent experiments. e Immunoblot analysis of FasL in the plasma membrane fraction as well as of FoxO1 and ATGL in the cytosolic fraction of 3T3-L1 adipocytes that had been incubated first in the absence or presence of 0.03 to 1 μM AS1842856 for 6 h and then in the additional absence or presence of GluOC (40 ng/ml) for 12 h. A representative blot, as well as quantitative data (means + SEM, normalized by the amount of N-cadherin or β-actin) from three independent experiments are shown. **p < 0.01 versus the corresponding value for cells incubated with GluOC alone (two-way ANOVA followed by the Tukey–Kramer HSD test)

